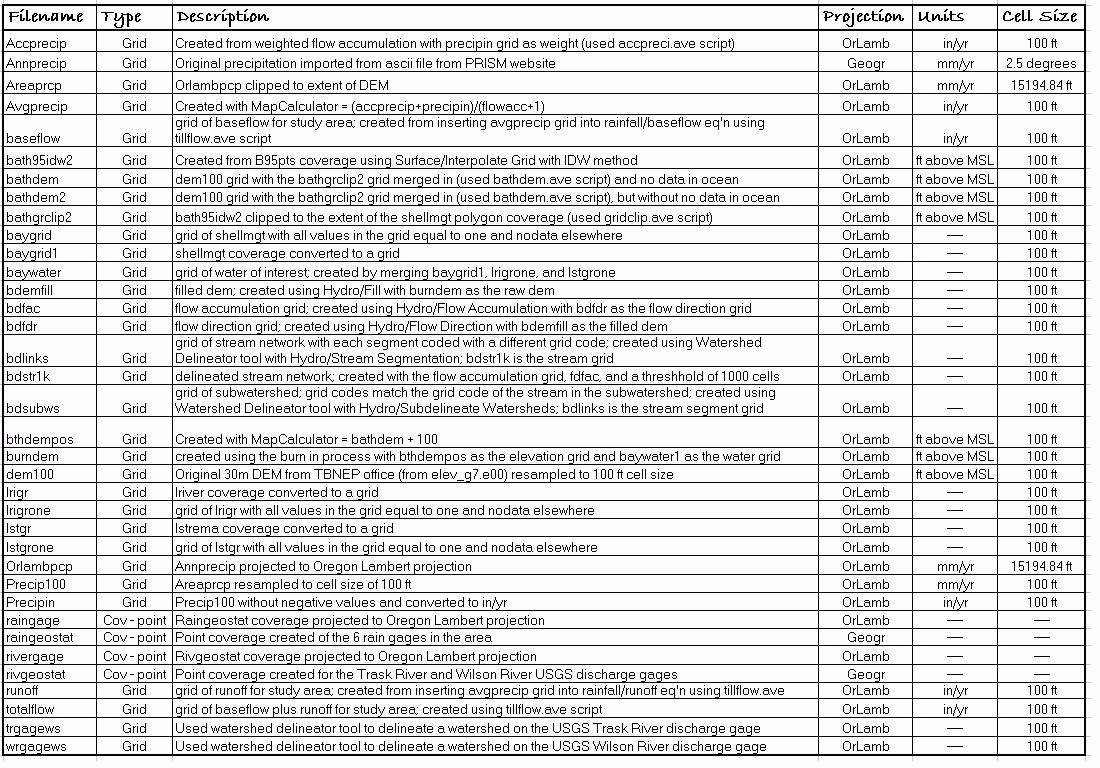
Tillamook Bay is part of the EPAs National Estuary Program. This program was established to identify, restore, and protect estuaries along the coast of the US. The Tillamook Bay National Estuary Project is coordinating efforts of various agencies and groups to restore the Tillamook Bay Estuary. Two of the biggest issues are bacteria and sediment loadings. The purpose of this term project is to begin to address the issue of sediment loads. Unfortunately, the semester is ending and the sediment loading issue has not been addressed. So, this paper will present the hydrology model that was developed.
This project will be carried out on the GIS platforms, ArcInfo and ArcView.
The work completed requires access to ArcView ver 3.0a with the Spatial
Analyst ver 1.1, the Hydrologic Modeling extension, and the ESRI/TNRCC
Watershed Delineator extension, as well as ArcInfo ver 7.1.1. Data
sources include:
TBNEP CDROM various coverages associated
with Tillamook Bay; this data may also be downloaded from a TBNEP webpage
USGS website
river discharge data
PRISM website
rainfall grid (raster data)
1996 NCDC ClimateData CDROM daily rainfall
data
The first part of the project will address development of the Digital Elevation Model and other model preparation tasks. The second part will describe the development of the hydrology model. I will indicate coverage or grid names in red, italicized text.
In order to determine data at a particular location, a point coverage must be created. This coverage will also be used to delineate watersheds. Two point coverages were created one for the Tillamook1W rain gage and one for the Wilson and Trask River USGS discharge gages. These coverages were created following the procedure in Exercise 4 for the class. The only difference is that when running the defgages.ave script the projection part is bypassed to default to geographic coordinates. A coverage was created from the shape file in Arc:
Arc: shapearc filename.shp covername
Arc: build covername points
The raingage files are called raingeostat.shp and raingeostat. The rivergage files are called rivgeostat.shp and rivgeostat.
The covername coverage was projected to the TBNEP Projection with the following file (called orlamb):
The Trask River gage point does not fall exactly on the Trask River
of the lriver coverage, so a dummy point was added closest to the point
designated by the USGS coordinates. This dummy point merely
designates the point that will be used to delineate from and to query for
information for the Trask River. This dummy point was created in
ArcView. With the rivergage coverage highlighted, choose Theme/Start
Editing. Select the point button ![]() ,
and click at a point within the Trask River of the lriver coverage.
Then choose Theme/Stop Editing, and save the edits. The attribute
table was edited to give the dummy location a gage number. This is
done in ArcView using Table/Start Editing and Stop Editing.
Save the edits.
,
and click at a point within the Trask River of the lriver coverage.
Then choose Theme/Stop Editing, and save the edits. The attribute
table was edited to give the dummy location a gage number. This is
done in ArcView using Table/Start Editing and Stop Editing.
Save the edits.
Digital Elevation Model (DEM)
The digital elevation model was obtained from the TBNEP office. It is a 30 meter DEM. The original export file is evel_g7.e00. This was imported to a grid called elev_g7. This dem grid has a cell size of 98.4252 feet. It is much easier to work with a cell size of 100 ft, so this dem was resampled to a cell size of 100 ft.
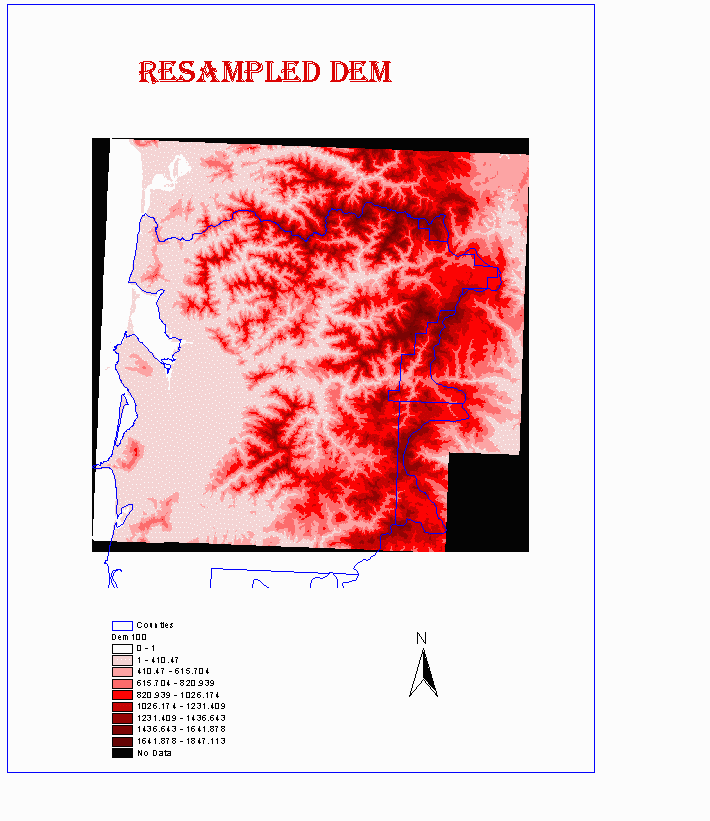
This dem has the value of zero for the bay area and the ocean. To have a continuous surface, the bay bathymetry data must be taken into account. In addition, as was discovered during this project, the ocean must have a value of 'no data' in order for the subwatersheds along the coast to be delineated properly.
Creating a Bathymetry Grid
The coverage B95pts on the TBNEP CDROM is a point coverage of measurements of depth to the bay floor. This coverage will be converted to a grid surface using the Surface/Interpolate Grid function in ArcView. Because the bathymetry data only applies to the bay area, the grid surface is interpolated only to the extent of the bay segments polygon (the shellmgt coverage from the CDROM). Under Analysis/Properties, set the Analysis Extent to "Same as Shellmgt" and the cell size to 100 (can be done by specifying "same as dem100). With the B95pts theme active, choose Surface/Interpolate Grid. Choose IDW as the method and depth as the z-value field. Use the default values for the other options in the dialog box. Choose OK and let it calculate. Using Theme/Save Data Set, this grid is saved as bath95idw2. Here is the interpolated surface:
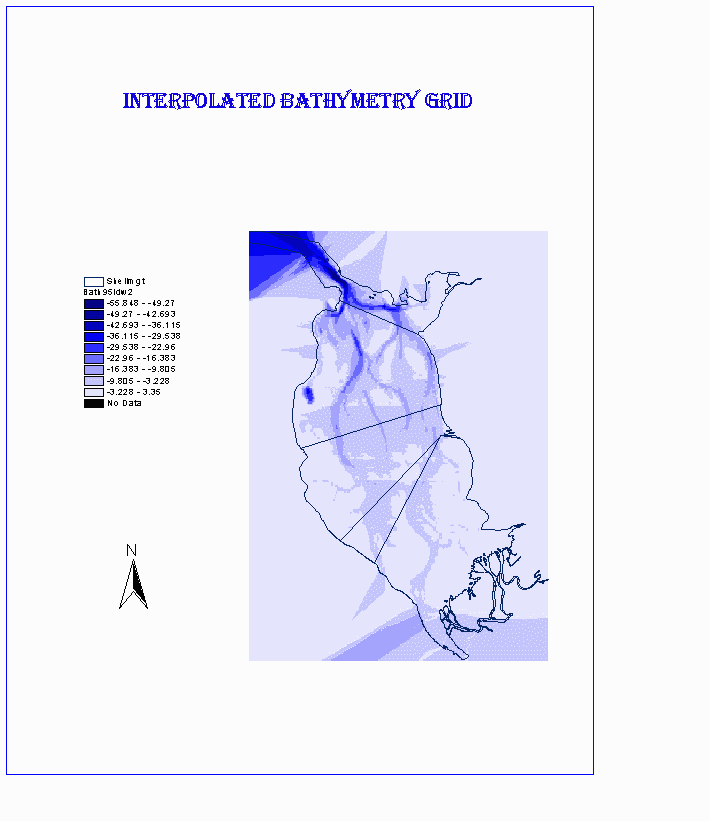
There is a relatively new coverage (not on the CDROM) available from the TBNEP homepage called Bath95sh. This coverage shows contours of the B95pts information. This coverage was used to verify the accuracy of the interpolated surface. The match seems to be pretty good.
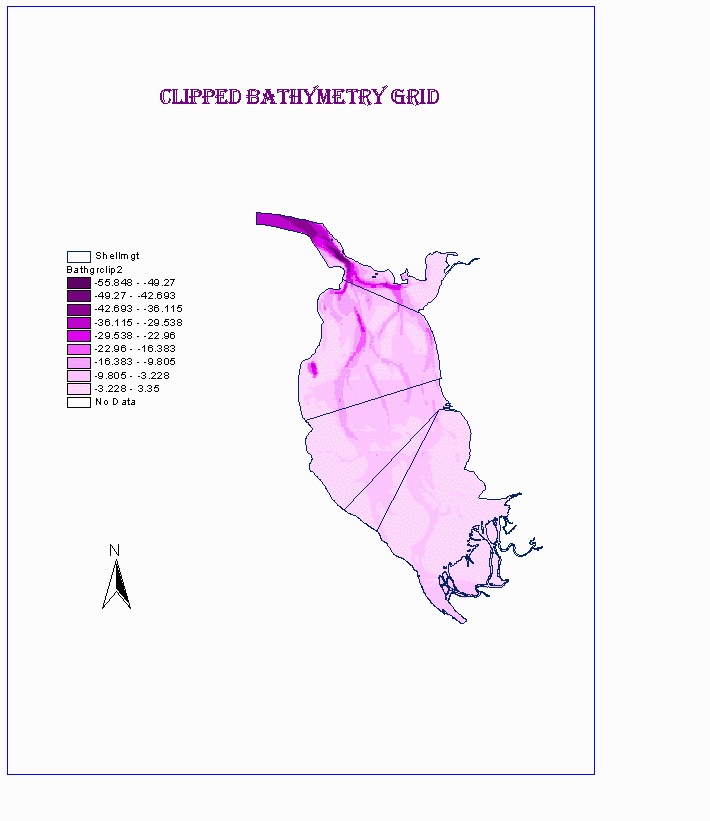
This grid covers a rectangular area to the extent of the shellmgt coverage. However, the bathymetry data is only needed in the area where the bay actually is located. Using the script gridclip.ave, the interpolated surface is clipped specifically to the actual extent of the the shellmgt polygon. Using Theme/Save Dataset, save this grid as Bathgrclip2. Here is the clipped bathymetry grid:
Now, the clipped bathymetry grid must be inserted into the larger dem100 grid. The script used to do this is called bathdem.ave. Before running the script, set the Analysis Extent to Same as dem100 and the cell size to Same as dem100. The aGrid is the clipped bathymetry grid and the bGrid is the dem100. In the merge operation, the new grid has the values of aGrid where aGrid is not "no data" and values of the bGrid where the aGrid is "no data." This has the effect of preserving the original dem values everywhere except where the Bathgrclip2 exists, and inserting the bathymetry grid data in those places. Using Theme/Save Dataset, save this grid as Bathdem2.
Inserting No Data Values in the Ocean
There are some values of no data in the bathdem2 grid, but these are at the very edges of the dem. More values of no data are needed in the bathdem2 grid from the northeast corner of the bay (essentially the outlet) out into the ocean area to the edge where no data currently occurs. This can be done in arctools using the edit function.
Burning in the DEM
Because the lowland area around all of the farmlands is so flat, we will "burn in" the streams and rivers. In the hydrology functions of ArcView, the direction of flow is determined using an eight point pour model. Then, flow accumulation is processed on the flow direction grid and a threshold is set that will define (or delineate) a stream. Because the lowland area is rather flat, the delineated streams do not closely match the actual streams. For this reason, the flow is artificially forced to accumulate in the actual streams. The "burn in" process allows this to be done. To preserve the bay bathymetry data, the bay will also be burned in along with the streams. The procedure in Section 3 part I of Exercise 6 of the Spring 97 GIS Class (Spatial Hydrology of the Urubamba River System) was used for the burn in procedure. The only difference is that the elevation is artificially raised by a value of 2000 feet rather than 5000 feet as in the Spring 97 Exercise 6.
In order to burn in the streams and bay, a grid coverage of them is needed. This grid coverage must be continuous (have no breaks/gaps). The data available included 3 coverages: lriver (polygon coverage of the 5 major rivers in the area), lstreams (line coverage of streams in the area), and shellmgt (polygon coverage of the bay). All three of these coverages can be found on the TBNEP CDROM. In ArcView, all three coverages were added to the view. The Analysis Window and Cell Size were set to the same as the dem. Then using Theme/Convert to Grid, each coverage was converted to a grid (called lstrgr, lrigr, and baygrid1). In ArcInfo, in Grid, everything is set to either a value of 1 or nodata using:
Problems with Delineating Subwatersheds
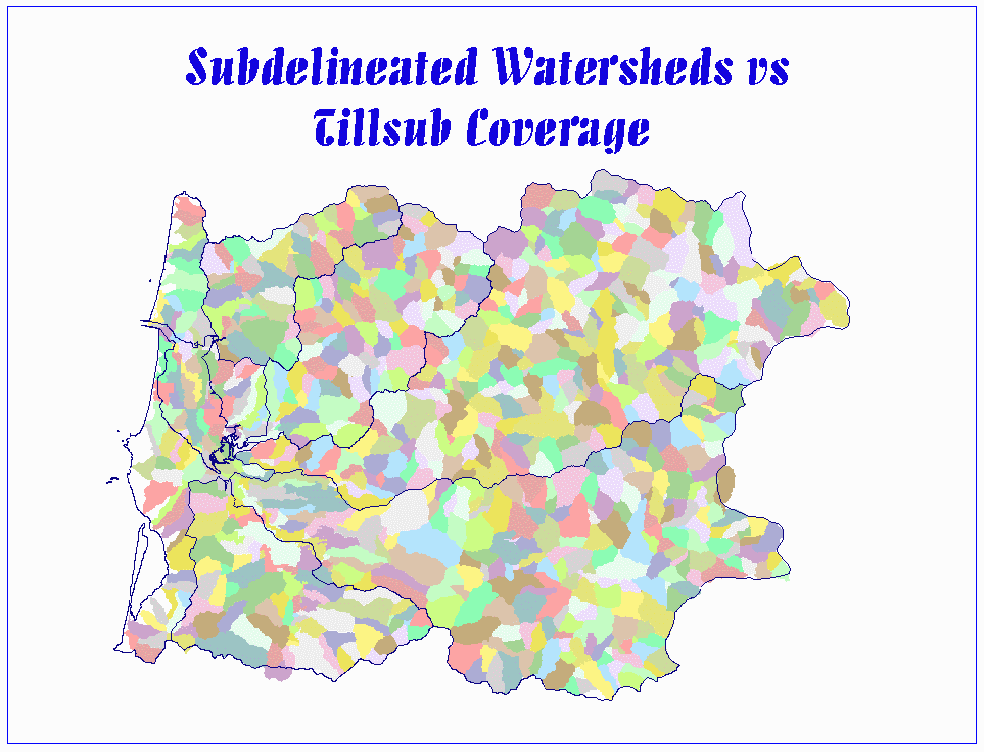
Subwatersheds were delineated using the ESRI/TNRCC Watershed Delineator extension. First the streams grid (bdstr1k) was cleaned up using arctools to delete streams that don't flow into the watershed. Then the streams were segmented into links using Hydro/Stream Segmentation. The segmented grid was saved as bdlinks. Using Hydro/Watershed Subdelineation with bdemfill as the filled dem, bdfdr as the flow direction grid, bdfac as the flow accumulation grid, and bdlinks as the segmented links, subwatersheds were delineated. The watersheds near the Pacific Ocean coastline were not delineated properly. Because of the small area of no data that was inserted at the outlet of the bay, all the flow is moving towards this no data area. The produced some subwatersheds with long thin arms stretching to the no data area. This problem was corrected by editing the bathdem2 grid so that all of the zero values in the ocean along the coast are changed to a value of no data; the resultant grid was saved as bathdem. Again, this was done in ArcInfo using arctools. Also, when the bathdem was used for the burn in procedure, there was a problem in conducting the Hydro/Fill process because there were negative values in the DEM in the bay area. This was corrected using Map Calculator by adding a value of 100 ft to the bathdem grid. This grid was saved as bthdempos. This resultant grid was used in the burn in process to get the burndem grid, then the burndem grid was filled, and flow direction and flow accumulation grids were computed. These three grids were then used to delineate subwatersheds. The subwatershed is saved as bdsubws. This grid was compared to the tillsub coverage from the TBNEP CDROM. This coverage shows the digitized watersheds, and the bdsubws grid seems to match fairly well. Here is a comparison of the tillsub coverage and the bdsubws grid:
Since the DEM had been changed, the delineation of watersheds for the Wilson and Trask river gages was reaccomplished. Because these watersheds are inland, they appear to have not been affected by the no data change, that is, the areas of the watersheds did not change.
Modeling the surface hydrology is a very important part of this project. The model of flow must match reality as closely as possible. The ultimate goal is to be able to model loadings to the bay, but it is also important to be able to differentiate contributions from different parts of the watershed, and to be able to look at loads to each of the 5 major rivers. The relationship between rainfall and runoff is an important part of the model. There are very few gaging stations in the area. The initial attempt to describe this relationship will be based on rainfall measurements at a rain gage in the lowland area, a statewide grid of long term annual precipitation, and discharge measurements at a USGS gage on the Wilson River, some distance from the rain gage. This relationship will be verified using data from a USGS gage on the Trask River. If data becomes available for discharge in the lowland areas, this data could be used as additional verification.
There are two types of precipitation information available. One is a grid of long term average annual precipitation obtained from the Oregon State University PRISM Project. The other is a dataset of daily precipitation values obtained from the 1996 NCDC ClimateData CDROM. The rainfall station used is the Tillamook1W. This gage is at the radio station in downtown Tillamook.
Precipitation Grid
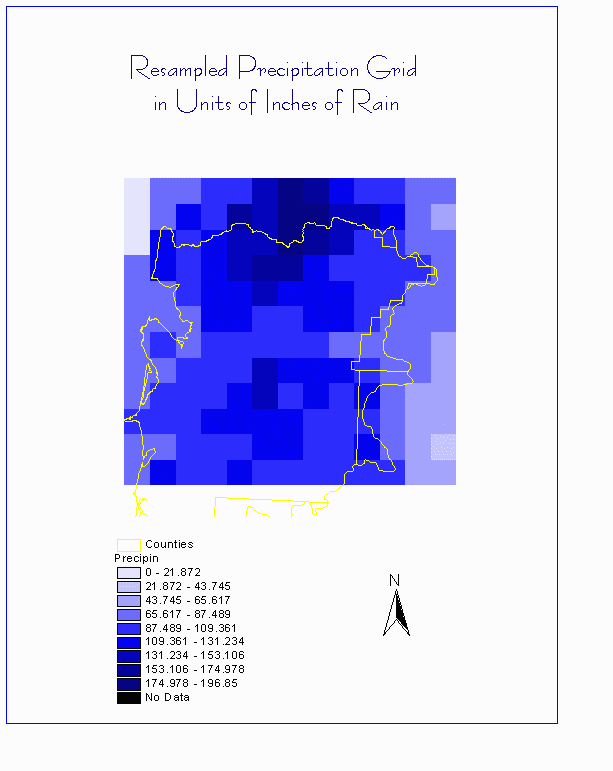
The precipitation grid was obtained from Oregon State University from their PRISM project. The grid for the state of Oregon was downloaded as an ascii file and imported. This can be done in ArcView a view must be opened and active. Go to File/Import Data Source and specify ASCII raster. This original precipitation grid is called annprecip. The original PRISM grid is long term average rainfall in mm/yr. This long term annual average is based on data from 1961 -1990. This grid was projected to the TBNEP projection discussed earlier.
Here is the precipin grid:
Daily Rainfall Data
Daily rainfall data was downloaded from the 1996 National Climatic Data Center CDROM for the following stations:
The next step is to determine an average precipitation grid that represents the average rainfall upstream of any given point. This grid will be used in deriving a rainfall/runoff relationship. Because rainfall is "converted" into runoff by hitting the land surface and flowing downhill, the runoff at any point is influenced by what happens to the land surface that is upstream from the point. The derived average precipitation grid is based on the precipin grid and the flow accumulation (bdfac) grid. In ArcView, a weighted flow accumulation was computed with the precipin grid as the weight using the script accpreci.ave. The bdfdr (flow direction based on the burned in dem) grid is the flow direction grid. The resulting grid is called accprecip. Using Analysis/Map Calculator, an average precipitation grid was calculated from (precipin + accprecip)/(bdfac + 1) this gives the average precipitation upstream of any given point. The resultant grid was saved as avgprecip and can be seen here:
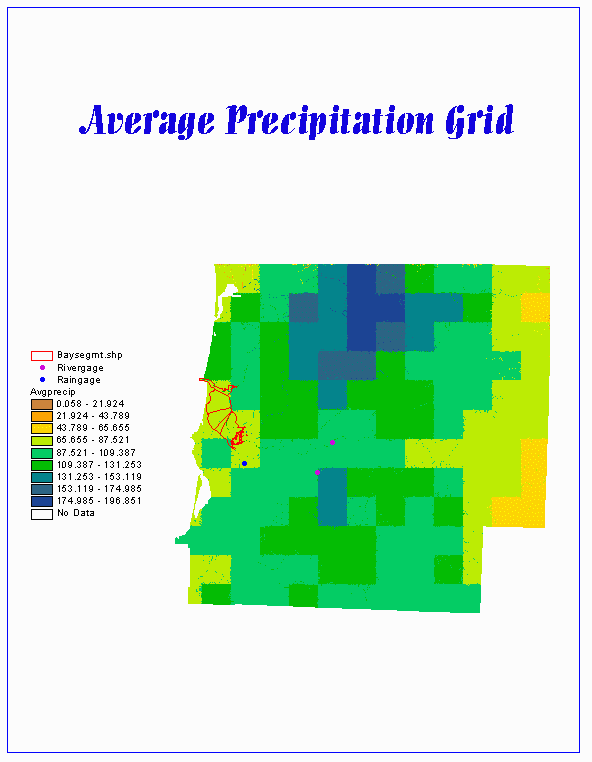
This grid will be used later and inserted into a rainfall/discharge relationship discussed in the next section.
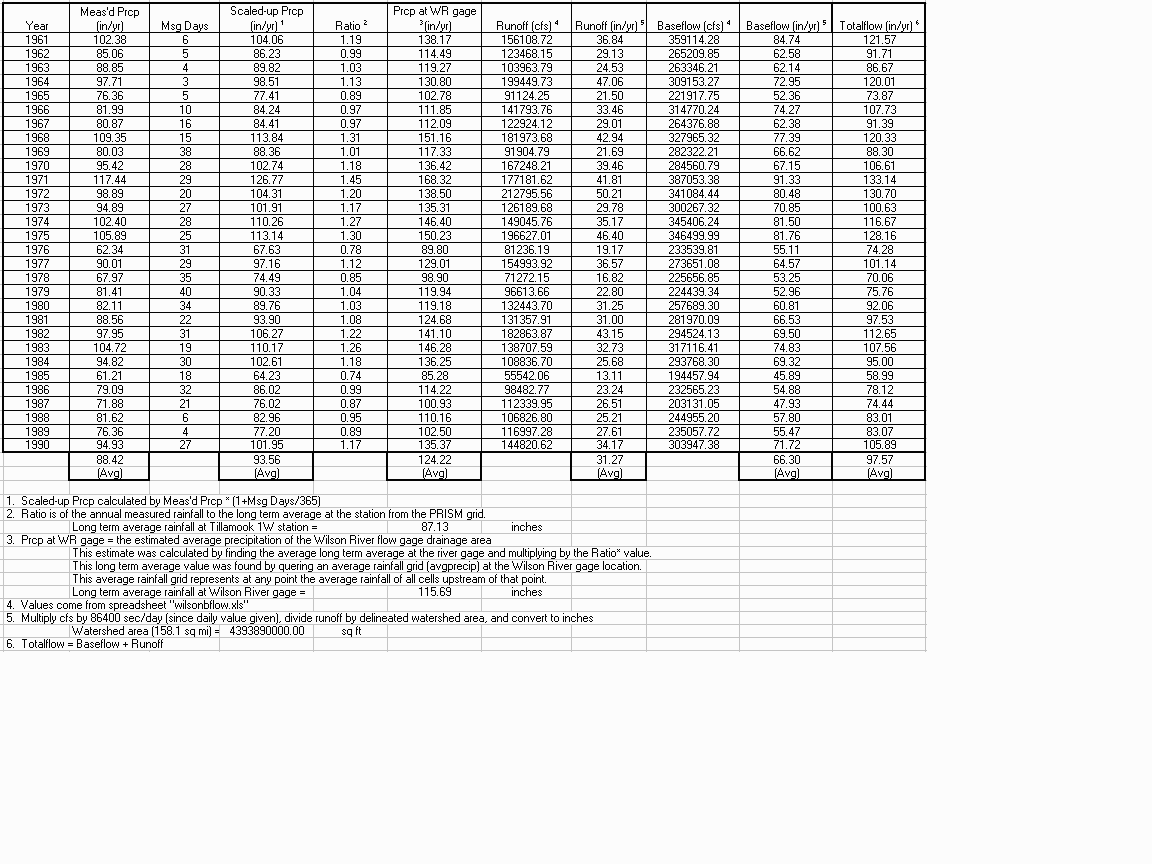
Discharge data for the Wilson River and Trask River were downloaded from the USGS website (http://waterdata.usgs.gov/nwis-w/US/) as a tab-delimited text file. This file was opened in Excel. The data given is daily discharge in cubic feet per second. The file also includes information on the location of the gage and the drainage area in square miles.
For the project, it is desirable to be able to look at baseflow versus surface runoff. The baseflow was separated out using a fortran program "bflow3.exe" written by Dr. F. Olivera. Information on this program can be found in chapter 4, section 4.2.1.1 of Dr. Olivera's doctoral dissertation. A length of time of 5 days was used as the flow peak duration parameter in the program. The program calculates the baseflow that is then subtracted from the total flow at the gage to get the surface runoff, hereafter referred to as runoff. Since the data is in cubic feet per second, the value is multiplied by 86400 sec/day to get cubic feet per day. When all of the daily values are summed for the year, the result is an annual volume of flow in cubic feet. The annual values of baseflow and runoff in cfs and cubic feet/year can be found in the spreadsheet "wilsonbflow.xls." These values are divided by the area of the delineated watershed and converted to inches to get a depth of flow.
Rainfall/Discharge Relationship
The Hydrology Model
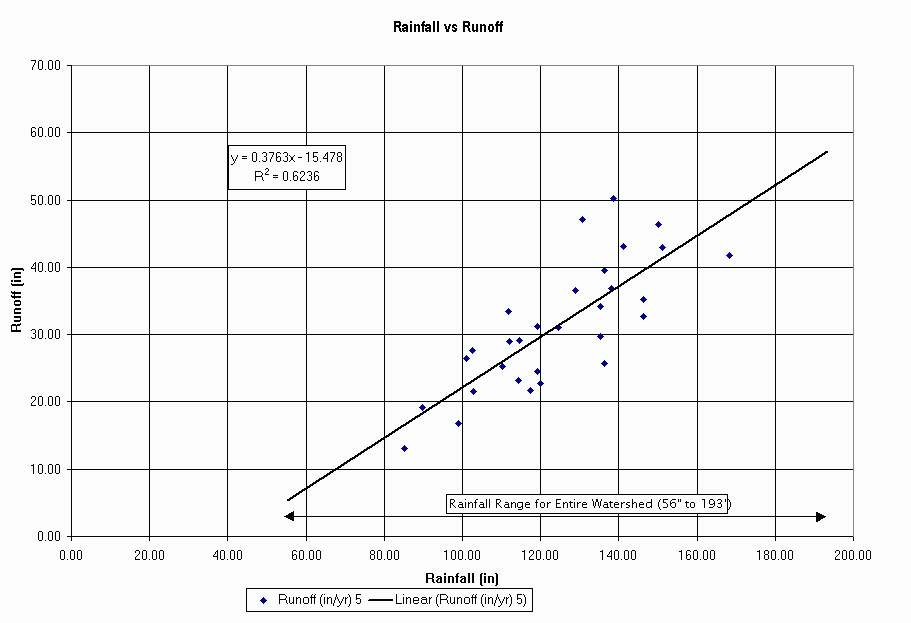
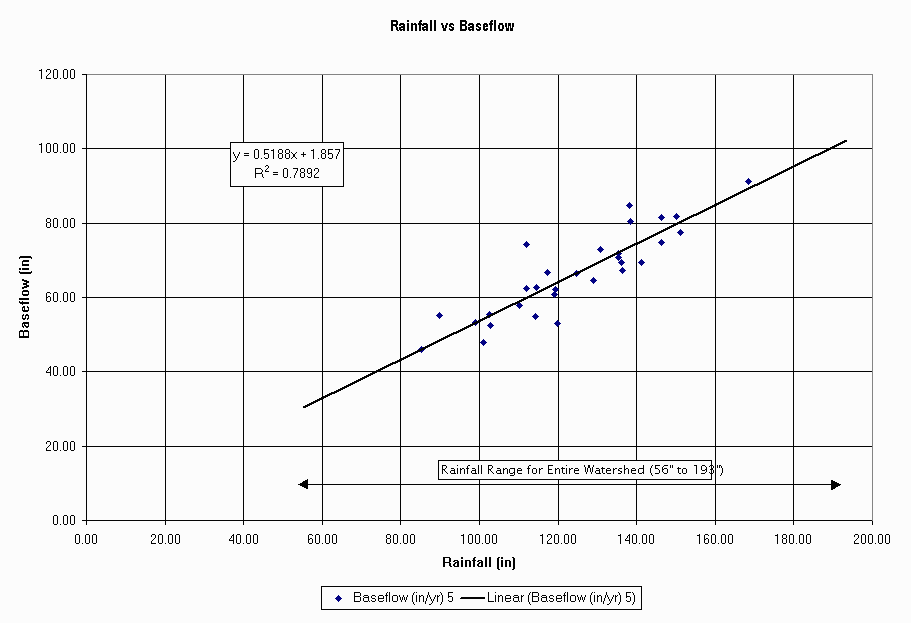
To begin to derive a relationship between rainfall and runoff (or baseflow), the annual rainfall at the Wilson River discharge gage must be known. The avgprecip grid was queried at the Wilson River gage location for an average long term value 118.30 in. For each year, this value was multiplied by the ratio of annual/long term annual for the Tillamook1W rain gage. This gives an annual predicted rainfall at the Wilson River gage. In Excel, rainfall versus runoff and rainfall versus baseflow were plotted for each year. Using linear regression, a line of best fit was added along with the equation of that line.
Click here to see the compiled data spreadsheet.
Click here for the rainfall vs runoff graph.
Click here for the rainfall vs baseflow graph.
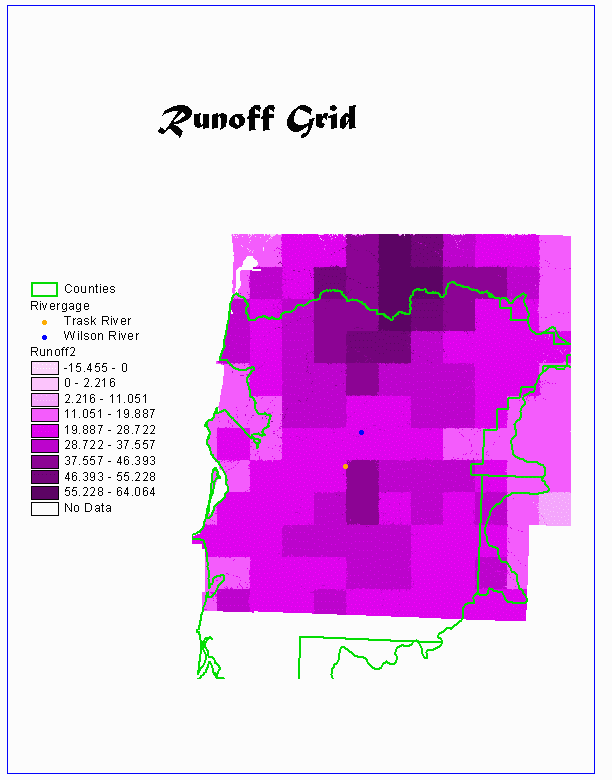
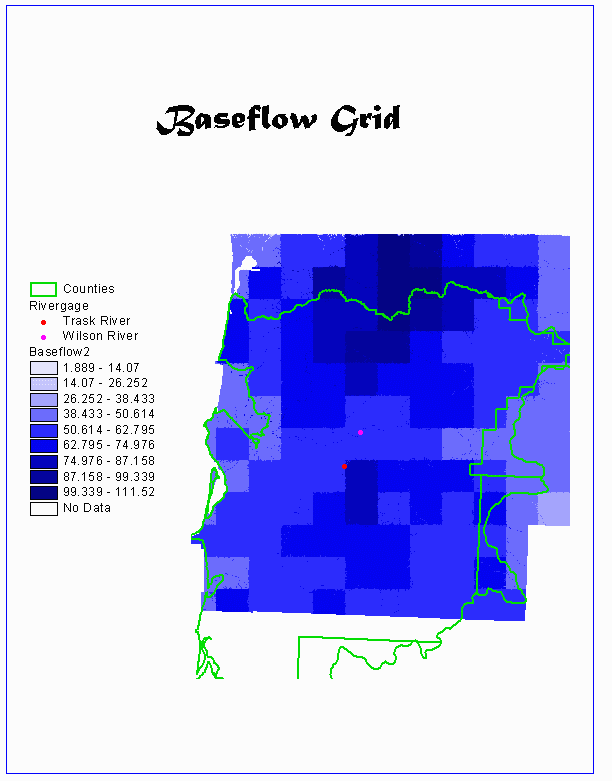
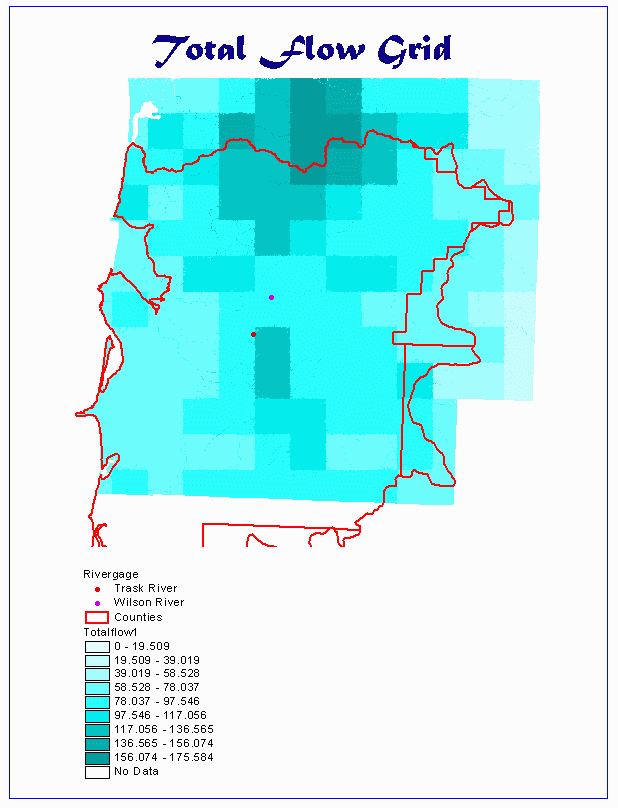
In ArcView, runoff, baseflow, and totalflow grids were computed in a similar fashion as for the Nonpoint Source Exercise from the Spring 1998 GIS Class. The equations derived from the linear regression were used in a script called tillflow.ave. This script plugs the avgprecip grid into the equations to compute a runoff grid, a baseflow grid, and a totalflow grid. Since the relationships developed are based on data from the Wilson River gage discharge, the values of these three grids at the location of the Wilson River gage should match the USGS data. However, on the first attempt, the values did not match. Upon inspection, it was discovered that the long term average annual rainfall at the Tillamook 1W gage (from the precipin grid) was not equal to the average of measured annual precipitation at the same location. In fact, the measure average is 1.0738 times the long term grid average value. For this reason, the script to calculate the discharge grids had to be modified to multiply the avgprecip grid by 1.0738 before inserting it into the equations. Click here for the modified script. With this modification, the values matched up very nicely.
This is what the runoff grid looks like:
This is what the baseflow grid looks like:
This is what the totalflow grid looks like:
Model Verification
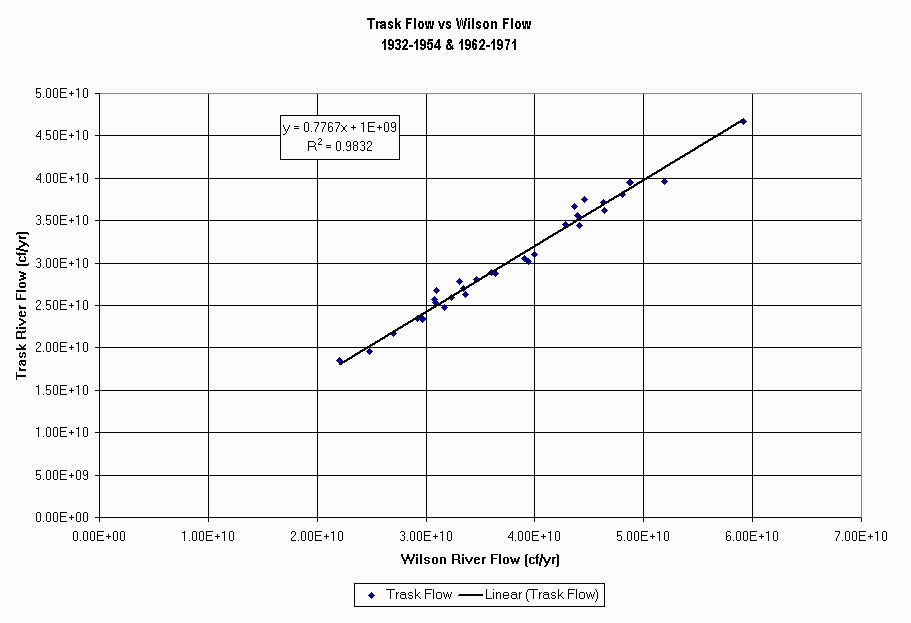
Before assuming that this hydrology model is accurate, it was desirable to verify the model using data from another location, specifically the Trask River. The data that were available for the Trask River gage included the years 1932 - 1954 and 1962 - 1971. In order to have data for the years 1961-1990, flow data was interpolated for the Trask River for 1961 and 1972 - 1990 using data from the Wilson River. Annual total flows (cf/yr) were plotted (Wilson River versus Trask River) for these 33 year periods in Excel. A trendline was fitted and the equation of best fit determined.
Click here for the graph with the line of best fit.
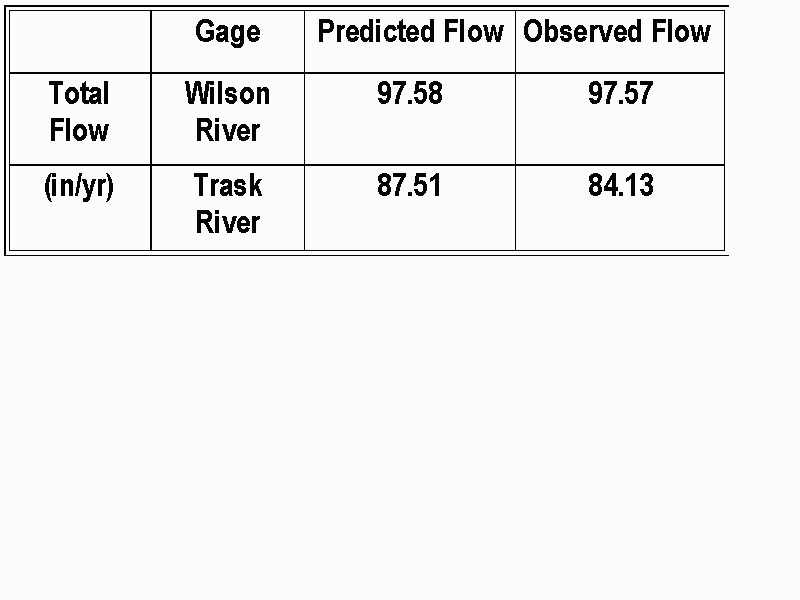
Using the equation of best fit, flows at the Trask River gage were estimated
for 1961 and 1972 - 1990. These annual flow values were averaged and compared
to the value obtained when the totalflow grid
was queried at the Trask River gage using the ![]() button.
In addition, annual flow values for the Wilson River gage were averaged
and compared to the value obtained for it from the totalflow
grid. Click
here to see a table comparing the results. Baseflow and runoff data
for the Trask River from USGS data have not yet been separated out or determined.
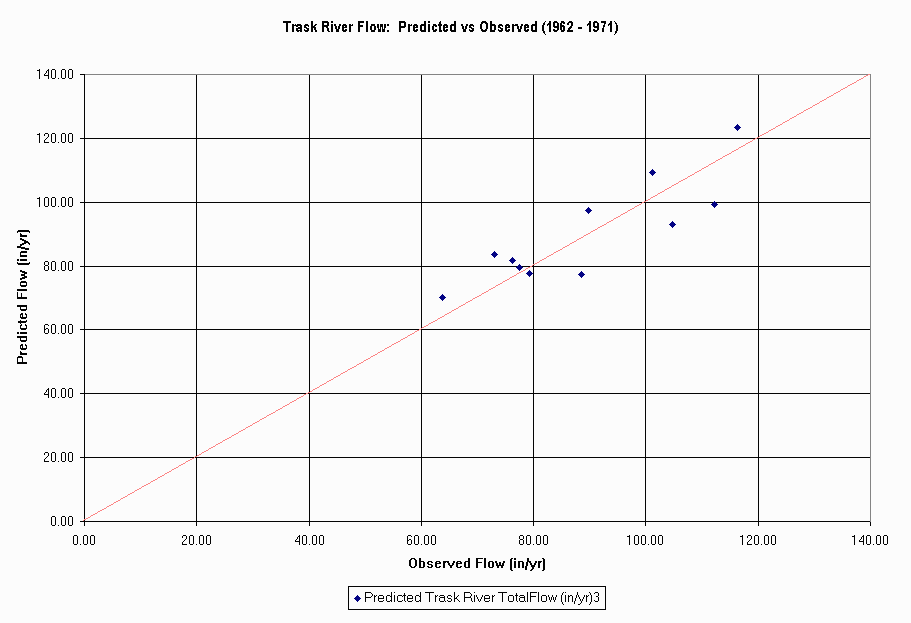
However, the total flow values from the model versus USGS data for the
Trask River gage are within 5%, with the model overestimating total flow.
button.
In addition, annual flow values for the Wilson River gage were averaged
and compared to the value obtained for it from the totalflow
grid. Click
here to see a table comparing the results. Baseflow and runoff data
for the Trask River from USGS data have not yet been separated out or determined.
However, the total flow values from the model versus USGS data for the
Trask River gage are within 5%, with the model overestimating total flow.
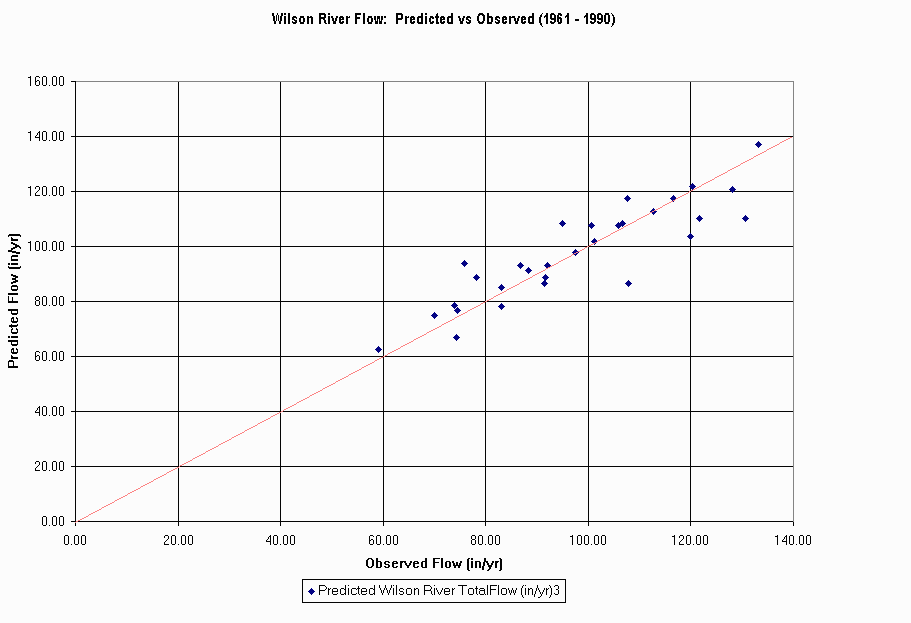
Predicted flows versus observed flows were plotted for both flow gages. The Wilson River data is for the entire period (1961-1990), while the Trask River data is only for years that flow data was available (1962 - 1971). The graph of Wilson River data can be seen here. The graph of Trask River data can be seen here. The red line on these graphs indicates a 1:1 match of predicted to observed data.
ArcView and ArcInfo have been successfully utilized to develop a digital database of the study area and to develop a model of the area hydrology. In addition, the hydrology model has been validated using data from the Trask River. This hydrology model will be used in later stages of Patrice Melancon's masters research work for the Tillamook Bay NEP.
The author would like to thank the following people and/or groups: