The data and exercises which support this Digital Atlas are designed to be used with the Arcview Version 3.0 Geographic Information System, though Version 2.1 can be used for many of the exercises. The descriptive material contains graphic files, some of them animated, which explain the origin and processing of the data. The Water Balance of the Niger Basin paper, xplains the background and methodology
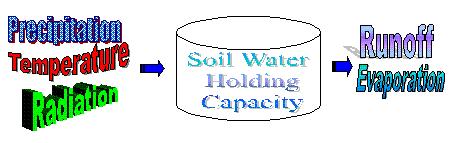
This Digital Atlas contains five types of data: precipitation, temperature, radiation, runoff and political boundaries. The precipitation, temperature and radiation data are depicted on a 0.5 degree grid spanning the earth (720 cells East-West, and 360 cells North-South, or 259,200 cells in all), covering both the land surface and the oceans. On each grid cell is presented the mean monthly and mean annual values of each variable in Arcview shapefiles. More information on these data can be found in the section on Data Sources. Mean monthly and mean annual runoff at 160 stations are found in the runoff directory. The political boundaries are used to delimit particular regions of interest in the data sets.
The data are presented in the following subdirectories:
Global data sets of mean monthly temperature and precipitation interpolated to a 0.5 grid were obtained by anonymous ftp to the University of Delaware (climate.geog.udel.edu). These data are from the "Global Air Temperature and Precipitation Data Archive" compiled by D. Legates and C. Willmott. The precipitation estimates were previously corrected for gage bias. Data from 24,635 terrestrial stations and 2,223 oceanic grid points were used to estimate the precipitation field. The climatology is largely representative of the years 1920 to 1980 with more weight given to recent ("data-rich") years (Legates and Willmott, 1990).
Global estimates of "plant-extractable water capacity" have recently become available on a 0.5 grid (Dunne and Willmott, 1996). As used in this Digital Atlas, the term plant-extractable water capacity is equivalent to water-holding capacity. One reason given for developing this global database was to eliminate the need for assuming spatially invariant plant-extractable water capacity in soil-water balance computations made over large areas. Information about sand, clay, organic content, plant rooting depth, and horizon thickness was used to estimate the plant-extractable water capacity.
It is axiomatic that the land surface water balance is connected to and bounded by the land surface energy balance since water cannot evaporate unless there is sufficient energy available to do so. A new radiation data set was recently made available by the Earth Radiation Budget Experiment (ERBE). These data are described in "GEWEX News," August, 1995, and were obtained by anonymous ftp to cloud.larc.nasa.gov. The data set includes longwave and shortwave radiation flux estimates for a 96 month period extending from July 1983 to June 1991. The data are given on the ISSCP equal-area grid which has a spatial resolution of 2.5 at the equator. Darnell and Staylor (1996) describe advances in input data and flux estimation algorithms that improve the ability to assess the radiation budget on a global scale. Input data improvements have come from the International Satellite Cloud Climatology Project (ISCCP) and ERBE. Using this satellite data, the radiation budget components that cannot be measured directly are estimated independently using physical approaches that have been validated against surface observations. According to Darnell et al., 1995, longwave flux estimates fall within +/- 25 W/m2 of surface measurements while Whitlock et al. estimate the accuracy of shortwave estimates to be within +/- 20 W/m2 of surface measurements. For comparison, the energy required to evaporate 1 mm/day of water is about 30 W/m2. In this study, net radiation (equivalent to net shortwave + net longwave) is used.
A new Surface Radiation Budget is in preparation which will contain monthly data from July 1983 through June 1995. The data set contained in the Digital Atlas of the World Water Balance is an annual average of the monthly values for the period July 1983 through June 1991.
Mean monthly runoff estimates have been calculated for 160 runoff stations were obtained from the Global Runoff Data Center, Koblenz, Germany. The attribute table displays the river, the station, the coordinates, the region, the first year of record, the last year of record, the total years of record, and the missing values in percent to total time series, as well as the monthly runoff data. One should note that the for the values recoded as 9999, the average was calculated as though there was no discharge for that month, rather than having a low discharge.
We are grateful for the guidance of Jean-Marc Faures and Philippe Pallas of FAO, and Alice Aureli of UNESCO in carrying out this research, and for the generous cooperation in sharing data provided by Cort Willmott of the University of Delaware (soil water holding capacity, precipitation and temperature data), Earth Radiation Budget Experiment (NASA) (radiation data), and the Direction General de l'Hydraulique, Rabat, Morocco (data for the Souss basin).