Defining a Stream Alignment
File
for the Corps Water
Management System
By David R. Maidment
Center for Research in Water Resources
University of Texas at Austin
18 March 2001
The Hydrologic Engineering Center of the US Army Corps of Engineers is presently deploying its new Corps Water Management System (CWMS). This system combines several hydrologic routing models with an Oracle database, time series data interface, a visual interface for model viewing and other utilities, including the use of Arc/Info and ArcView for GIS data manipulation and display. Central to this process is the definition of a Stream Alignment file, which serves as a means of spatially coordinating the exchange of data between the hydrologic simulation models at common spatial locations. This exercise describes how such a file can be created using Arc/Info 8.1. The example stream chosen is the Tuolumne River and its Dry Creek tributary in Modesto, CA. A normal CWMS application covers a much larger spatial region, but this example is sufficient to show a mechanism for defining the stream alignment file. The exercise is based on a Stream.shp shapefile, used as part of the March 12-16, 2001, HEC training course on application of GIS to flood damage assessment.
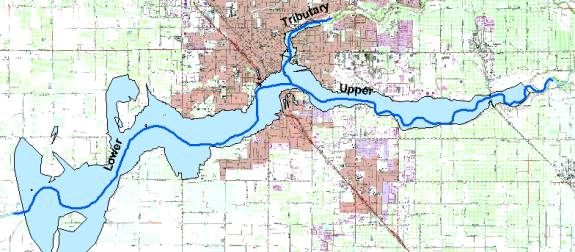
Lower and Upper Tuolumne River Reaches and Dry Creek Tributary reach.
The backdrop display is the 500 year floodplain delineation and digital raster graphic map of Modesto, CA. Data files from HEC training course on GIS for flood damage assessment.
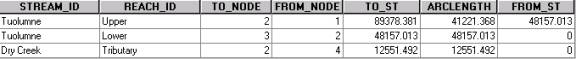
To begin this process, the Stream.shp file was imported into an ArcInfo 8.1 geodatabase called Modesto. I did not know the map projection of these data so I left that blank. The X/Y reference frame parameters were set as MinX = 6000000, MinY = 2000000, Precision = 1000, which provides a sufficient range to display data with these coordinates. The M domain parameters were set as Min = 0, Precision = 1000, which provides sufficient range to describe the measure values to be used (0-90,000). The required X/Y reference frame parameters can be assessed by displaying the data in ArcView 3.2, and examining what range the coordinates cover in the View window. The Stream.shp file has three routing reaches, the Upper and Lower reaches of the Tuolumne River, and the Dry Creek tributary of this river.
Stream Reaches
Tools in the PolyLineM toolbar
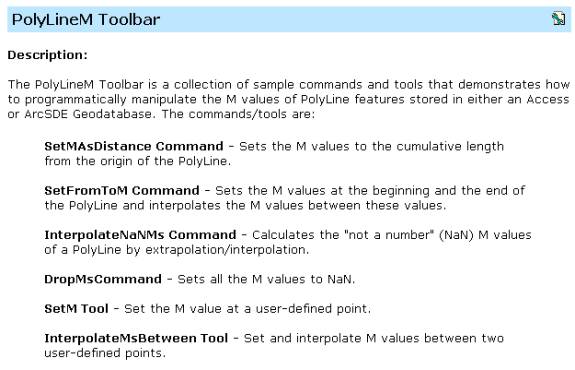
I used some tools in the ArcObjects Developer Help, where there is a PolylineM toolbar in /Samples/Editing/Working with Ms section. The required PolyLineMTools.dll file must be registered to ArcMap using the RegCat.exe icon in order to access the PolyLineM toolbar.
I used the SetFromToM Command to set the M values for each vertex on each of the three reaches using the To_St and From_St values given in the Stream.shp attribute table. One factor that needs to be remembered is that the stream vertices are arranged in the downstream direction in this dataset and the desire is to have the Measure values increasing in the upstream direction, so in each case “From” is interpreted as “from the first vertex” in the line, which is at the upstream end, and thus must be assigned the larger measure value (To_St). Likewise, “To” is interpreted as “to the last vertex” in the line, which is at the downstream end, and thus is assigned the smaller measure value (From_St). Note that the PolyLineM toolbar has several other options, which allow the placement of M values at user-defined points (SetM), and interpolation M values between these points (InterpolateMsBetween). There are automated ways in which Measure values can be assigned to sets of lines without manual selection. The end result of this action is that each coordinate on the stream has an assigned measure value consistent with the Measures at its end points. The examples shown below illustrate how the vertices each have an assigned measure ranging from 0 at the lower end upstream. It is demonstrated that even though the Lower and Upper reaches of the Tuolumne River are separate lines, the vertex Measure values continue to increase uniformly going upstream from one line to the next. The two reaches of the Tuolumne River have a common measure value of 48157.013 at the location where they join.
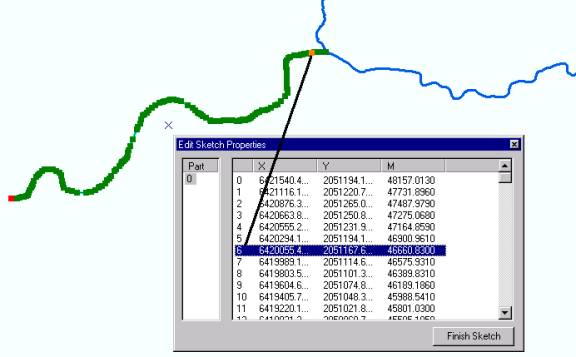
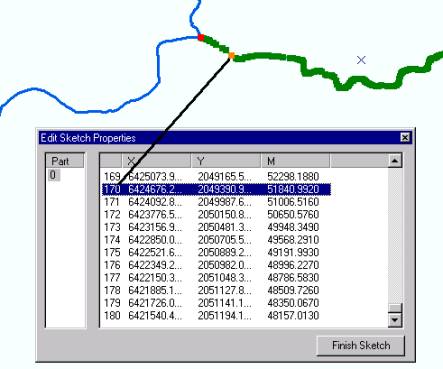
Coordinates of Vertices on the Lower Tuolumne River
reach. Coordinate 0 has measure
48157.013 at the Confluence with Dry Creek
Coordinates of Vertices on the Upper Tuolumne River
reach. Coordinate 180 has Measure
48157.013 at the Confluence with Dry Creek
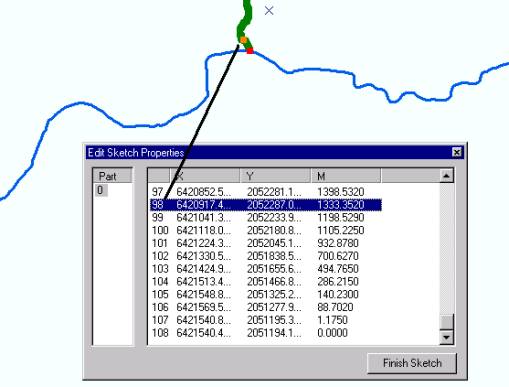
Coordinates of Vertices on the Dry Creek Tributary.
Coordinate 108 has Measure 0.00 at the Confluence of Dry
Creek and the Tuolumne River.
Definition of the Stream Alignment File
A stream alignment file consists of two files, here called StreamNode and StreamLine. StreamNodes are defined at any location on a stream of interest for modeling purposes. StreamLines are defined between stream nodes. Measures along StreamLines may continue consecutively along successive line segments of a river stream or river, as shown above for the Tuolumne River.
To define the Measure values of points of interest, I used the IdentifyMs tool which is also in the ArcObjects Developers Help under /Samples/Dynamic Segmentation/ArcMap. With this tool, you can click on a line at any location and obtain an M value. In Arc Catalog, I prepared two tables: one for point events called StreamNode, with attributes StreamNode (text, 20 characters), StreamID (text, 20 characters), Measure (Double) and another for line events called StreamLine, with attributes StreamLine (text, 20 characters), StreamID (text, 20 characters), FromMeasure (Double), ToMeasure (Double). Using ArcMap, I manually filled in the required data for each node and line value in these tables. There is probably a way to simplify this process using an interface.

StreamNode Table
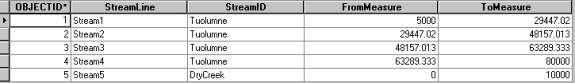
StreamLine Table
By right clicking on the tables I created, I was able to display the corresponding data as Point Events and Line Events over the top of the Stream.shp file, which defines the spatial (X,Y) coordinates of the corresponding records in the StreamNode and StreamLine tables. In doing this, I had to define a new attribute called StreamID in Stream.shp as (Text, 20 characters) and copy the contents of the Stream_ID attribute to it, because Stream_ID is (Text, 16 characters) and may not match correctly with its related StreamID text field in the StreamNode and StreamLine tables.
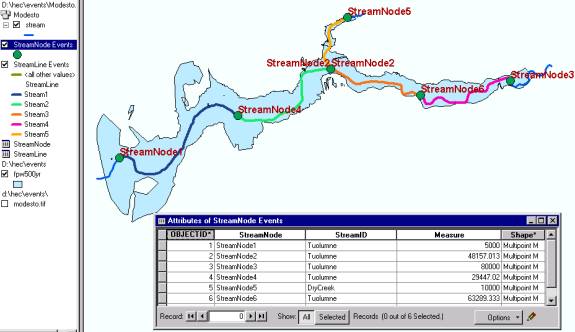
Display of StreamNode Events
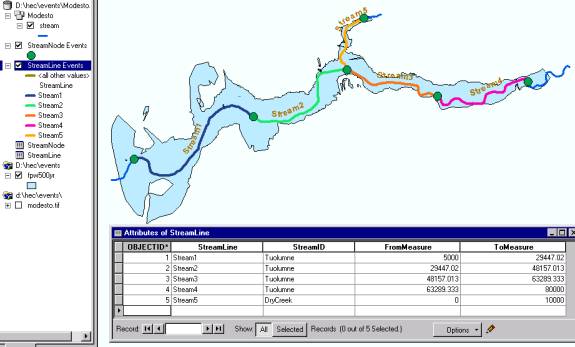
Display of StreamLine events
It can be seen the choice of the StreamNode locations is arbitrary along the Stream.shp line, although I did put at the Confluence of Dry Creek with the Tuolumne River, on the Tuolumne River (StreamNode 2).
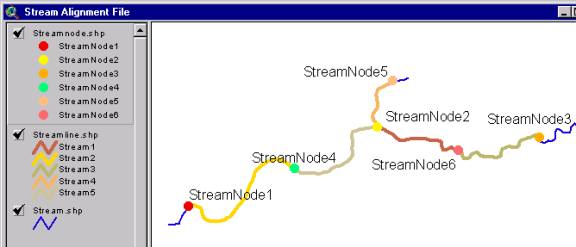
Display of the Stream Alignment file in ArcView 3.2
Once the point and line events are displayed in ArcMap, they can be exported to Shapefiles as StreamLine.shp and StreamNode.shp for independent display and visualization over the top of other data layers in the Corps Water Management System interface.
There is probably some merit in examining whether the Stream Alignment file just created could more intimately be linked to the geospatial data files supporting the HMS, RSS, RAS, and FIA components of the Corps Water Management System by building the Stream Alignment file on top of the Hydro Network in the ArcGIS Hydro data model developed for the ArcGIS 8.1 software, rather than simply using a stream shapefile as shown here.