Eric Tate
CE 397
May 7, 1998
etate@eqe.com
Term Project: Risk Assessment
of the American Creosote Site
Table of Contents:
- Introduction
- Site Background
- Data Management
- Data Reduction
- Exposure Point Concentrations
- Exposure Assessment
- Toxicity Assessment
- Risk Characterization
- Conclusions
- References
In 1980, the U.S. Congress passed the Comprehensive Environmental Response, Compensation,
and Liability Act (CERCLA) and delegated enforcement powers to the U.S. Environmental
Protection Agency (EPA). This landmark piece of legislation established a large fund
(often called the "Superfund") earmarked to clean up the inactive and abandoned hazardous
waste sites in the country within several years. When the funding authorization expired
six years later and not much progress had been made, we began to grasp the massive scope
of complete environmental remediation. Several factors, including the lack of understanding
of chemical fate and transport processes, equipment problems, and high costs forced policy
makers to adopt a new paradigm for environmental cleanup: focus resources on the worst sites.
To embark in this new direction, hazardous waste sites needed to be ranked so that the
remedial project managers could evaluate which sites demanded immediate attention and which
could could wait. In the late 1980s, EPA began using risk to human health and the environment
as a primary factor in its ranking process, in the form of its Hazard Ranking System (HRS).
Over the last decade, state and municipal environmental agencies have also begun to make
environmental decisions based on risk. This has spawned a new field of science: environmental
risk assessment. In short, it's a procedure for assessing the condition of the environment and
its potential for harmful consequences. Today, environmental risk assessments are a frequently
used tool both to determine remediation goals and to quantify the possibility that human health
and/or the environment has been impacted by anthropogenic environmental contamination. To
complete an environmental risk assessment, the risk assessor must possess an understanding
of several scientific disciplines, including statistics, environmental fate and transport,
chemical exposure routes, and toxicology. For my term project, I've put on the risk assessor's
hat to conduct a human health risk assessment of the American Creosote site.
The American Creosoting site, is a former wood-treating facility that operated for about 30
years from the 1940's to the 1970's. Wood products such as railroad ties and utility poles
were pressure treated on the property using creosote, pentachlorophenol (PCP), and chromated
copper arsenate. During operation, wood-treating wastes including untreated process wastewater,
spilled chemicals, and waste surface impoundment sediment were discharged to drainage ditches.
Through stormwater runoff over the years, these wastes have become transported and redeposited
along drainage ditches downgradient of the site. Previous site investigations have found site-
related chemicals in offsite areas adjacent to the property and historical drainage pathways.
The site is currently abandoned, but is bordered by residential properties and an apartment
complex. Area residents have reported the presence of black, weathered, creosote-like material
in their yards and nearby drainage ditches. The most recent site investigation focused on
characterizing the extent and magnitude of offsite contamination due to stormwater flow and
historical chemical spills. Numerous soil and drainage ditch sediment samples were collected
down to a depth of 2 feet from residences and drainage pathways adjacent to the former facility.
The samples consisted of approximately 400 samples from suspected areas of contamination
(characterization samples) and approximately 70 samples from areas believed to be unaffected by
historical site operations (background samples). The primary contaminants of concern were found
to be polycyclic aromatic hydrocarbons (PAHs), PCP, copper, chromium, arsenic, polychlorinated
dibenzodioxins, and polychlorinated dibenzofurans. The goal of this report is to perform a human
health risk assessment of potential receptors in the offsite residential areas bordering the site.
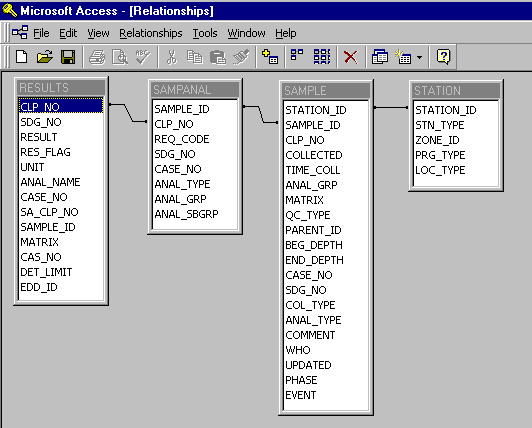
A Microsoft Access database was used to manage, store, and query the nearly 14 megabytes of
laboratory data generated during the most recent site investigation. The data initially
consisted of four separate databases containing information about each sample such as
identification numbers, locations, depths, media, collection dates and times, analysis type,
and the concentration (magnitude and units). Once imported into Access, relationships between
the databases were established:
The next step was to set up a series of database queries to retrieve only the needed information
about the samples. Based on the results of the site investigation, an intial list of chemicals
of concern (COCs) was created. COCs are chemicals identified at the site which may be present
at concentrations of potential human health concern. The intial COC list consisted of PAHs, PCP,
and metals, and is shown as follows:
| Organics |
Metals |
|---|
| Acenaphthene | Dibenz(a,h)anthracene | Aluminum | Magnesium |
| Acenaphthylene | Fluoranthene | Antimony | Manganese |
| Anthracene | Fluorene | Arsenic | Mercury |
| Benzo(a)anthracene | Indeno(1,2,3-cd)pyrene | Barium | Nickel |
| Benzo(a)pyrene | Naphthalene | Beryllium | Potassium |
| Benzo(b)fluoranthene | 2-Methyl Naphthalene | Cadmium | Selenium |
| Benzo(g,h,i)perylene | Pentachlorophenol | Calcium | Silver |
| Benzo(k)fluoranthene | Phenanthrene | Chromium | Sodium |
| Chrysene | Pyrene | Cobalt | Thallium |
|
| Copper | Vanadium |
|
| Iron | Zinc |
|
| Lead |
|
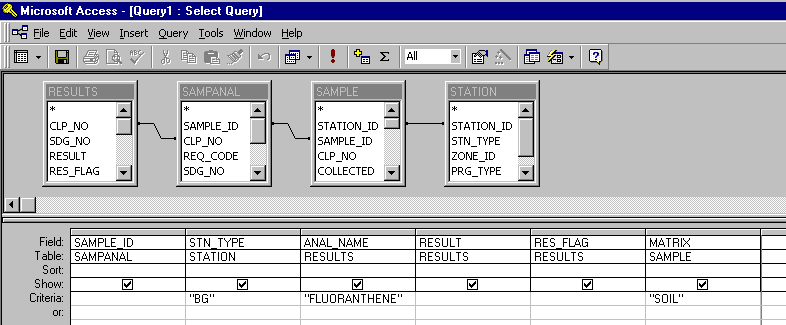
Queries for each of the 41 initial COCs were subsequently set up. The requested information
included the sample identification number, station type (background or characterization),
analysis, concentration, sample qualifier (detected or undetected), and sample matrix (soil).
A query for the background and characterization samples for each COC was constructed, resulting
in a total of 82 tables. A typical query window looked like this:
The query tables were next imported in to Microsoft Excel in order to perform statistical
calculations. The goal was to cull the list of initial COCs. Specific chemicals were eliminated
based on the following criteria:
- Frequency of Detection. If a constituent was detected in fewer than 5% of
the characterization samples, the constituent was eliminated from further consideration.
- Comparison to Background. A student's t-test was performed on the data of
each constituent to determine if the mean concentration of the characterization samples was
different from that of the background samples. If the two data sets are described by the
variables x and y, which have n and m data values and standard deviations of Sx
and Sy, then the t-statistic can be calculated as follows:

For calculation of the mean background and characterization sample concentrations, all data
with no qualifiers or with "J" qualifiers (estimated concentration) were assumed to be positive
identifications. If a constituent was reported as a non-detect ("U" qualifier), it was assumed
to be present at one-half of the sample quantitation limit. If |t|<2 for a given constituent,
the means of the two data sets are not considered different (the two data sets cannot be
statistically distinguished from one another) and the chemical was eliminated from further
consideration.
- Essential Nutrients. Naturally occurring inorganic chemicals that are
considered as essential nutrients (calcium, iron, potassium, magnesium, and sodium) were
eliminated as COCs.
Use of these data reduction criteria trimmed the COC list from 41 chemicals to 27.
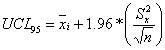
An exposure point concentration (EPC) is an estimate of the mean concentration of a chemical
in a medium, averaged over an area where human exposure is assumed to be random. In
accordance with EPA guidance (EPA, 1992), the upper 95% confidence limit of the arithmetic mean
(UCL95) was used in the exposure calculations. The formula used to calculate the
UCL95 concentration for a particular consituent is contingent upon the distribution
of the data. Distribution type for the characterization data was determined using the
coefficient of skewness test. For |skewness coefficient|<1, the data was considered to be
normally distributed. Otherwise, a lognormal distribution was assigned. A preponderance of
the data turned out to be lognormally distributed. For the normally distributed constituents,
the UCL95 was calculated using the following equation:
For lognormally distributed constituents, the mean and standard deviation are calculated
based on log-transformed data. The UCL95 concentration was calculated as follows:
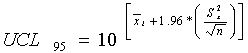
As in the student t-test calculations, all data with no qualifiers or with "J" qualifiers
were assumed to be positive identifications and data with "U" qualifiers were assumed to
be present at one-half of the sample quantitation limit. The results of the data reduction
UCL95 calculations are shown in the following tables (the eliminated chemicals
are highlighted):
| |
Skew |
|
Detect |
|
|
UCL95
|
| Constituent |
Coeff. |
Distn |
Freq. |
T-Test |
Removed? |
(mg/kg)
|
| 2-Methylnaphthalene |
13.50 |
Lognormal |
0.2% |
-3.61 |
Yes |
--- |
| Acenaphthene |
13.51 |
Lognormal |
1.2% |
-2.85 |
Yes |
--- |
| Acenaphthylene |
13.98 |
Lognormal |
6.2% |
-22.78 |
No |
433 |
| Anthracene |
12.35 |
Lognormal |
11.8% |
-2.35 |
No |
237 |
| Benzo(a)anthracene |
18.42 |
Lognormal |
20.7% |
-2.68 |
No |
245 |
| Benzo(a)pyrene |
9.60 |
Lognormal |
27.6% |
-3.50 |
No |
263 |
| Benzo(b)fluoranthene |
9.35 |
Lognormal |
30.5% |
-5.06 |
No |
307 |
| Benzo(g,h,i)perylene |
13.84 |
Lognormal |
27.8% |
-12.04 |
No |
479 |
| Benzo(k)fluoranthene |
8.50 |
Lognormal |
22.2% |
-3.79 |
No |
267 |
| Chrysene |
8.97 |
Lognormal |
30.0% |
-4.52 |
No |
288 |
| Dibenz(a,h)anthracene |
11.13 |
Lognormal |
13.8% |
-2.77 |
No |
243 |
| Fluoranthene |
13.92 |
Lognormal |
22.2% |
-2.76 |
No |
246 |
| Fluorene |
13.50 |
Lognormal |
1.5% |
-2.88 |
Yes |
--- |
| Indeno(1,2,3-cd)pyrene |
10.92 |
Lognormal |
27.6% |
-4.25 |
No |
292 |
| Naphthalene |
13.50 |
Lognormal |
0.2% |
-3.69 |
Yes |
--- |
| Pentachlorophenol |
12.69 |
Lognormal |
4.4% |
-3.51 |
Yes |
--- |
| Phenanthrene |
16.30 |
Lognormal |
9.1% |
30.37 |
No |
219 |
| Pyrene |
12.67 |
Lognormal |
24.4% |
-2.77 |
No |
243 |
Metals
| |
|
|
Detect |
Essential |
|
|
UCL95 |
| Constituent |
Skew |
Distn |
Freq. |
Nutrient? |
T-Test |
Removed? |
(mg/kg) |
| Aluminum |
6.74 |
Normal |
100% |
No |
-2.66 |
No |
15,773 |
| Antimony |
2.48 |
Lognormal |
7.1% |
No |
3.55 |
No |
2.80 |
| Arsenic |
21.07 |
Lognormal |
99.7% |
No |
-3.63 |
No |
6.26 |
| Barium |
7.93 |
Lognormal |
100% |
No |
-3.33 |
No |
193 |
| Beryllium |
0.18 |
Normal |
91.9% |
No |
-2.89 |
No |
1.08 |
| Cadmium |
1.60 |
Lognormal |
28.7% |
No |
0.21 |
Yes |
--- |
| Calcium |
1.09 |
Lognormal |
100% |
Yes |
-0.75 |
Yes |
--- |
| Chromium |
1.40 |
Lognormal |
99.7% |
No |
-3.06 |
No |
18.9 |
| Cobalt |
-0.22 |
Normal |
100% |
No |
-3.32 |
No |
10.2 |
| Copper |
0.17 |
Normal |
98.7% |
No |
-4.02 |
No |
17.9 |
| Iron |
10.08 |
Lognormal |
100% |
Yes |
-2.62 |
Yes |
--- |
| Lead |
5.19 |
Lognormal |
100.0% |
No |
-2.98 |
No |
16.3 |
| Magnesium |
-0.18 |
Normal |
100% |
Yes |
-2.06 |
Yes |
--- |
| Manganese |
0.67 |
Normal |
100% |
No |
-2.59 |
No |
549 |
| Mercury |
14.58 |
Lognormal |
10.1% |
No |
0.40 |
Yes |
--- |
| Nickel |
-0.24 |
Normal |
98.7% |
No |
-3.15 |
No |
22.8 |
| Potassium |
0.51 |
Normal |
99.5% |
Yes |
-2.82 |
Yes |
--- |
| Selenium |
1.02 |
Lognormal |
57.1% |
No |
-2.81 |
No |
0.96 |
| Silver |
8.12 |
Lognormal |
4.8% |
No |
0.28 |
Yes |
--- |
| Sodium |
2.25 |
Lognormal |
83.6% |
Yes |
-3.21 |
Yes |
--- |
| Thallium |
3.85 |
Lognormal |
3.3% |
No |
-9.15 |
Yes |
--- |
| Vanadium |
6.90 |
Lognormal |
97.0% |
No |
-2.87 |
No |
28.7 |
| Zinc |
6.74 |
Lognormal |
100% |
No |
-4.41 |
No |
61.6 |
The primary focus of the exposure assessment is to quantify the magnitude of human exposure
to the COCs. The key elements of the exposure assessment include identifying the potential
receptors and exposure scenarios, and calculation of chemical intakes (doses). The receptors
of primary concern at this site are offsite residents who may be exposed to site-related
chemicals in the soil. Both children and adults are assumed to be exposed to the exposure
scenarios evaluated. These consist of the following:
- Dermal Contact
- Incidental Ingestion
- Particulate Inhalation
Each receptor was evaluated using the reasonable maxium exposure (RME) assumption. The RME
case is designed to be a measure of high-end exposure representing an estimate of upperbound
risk (approximately the 95th percentile of the dose distribution). The purpose of the RME is
to obtain a conservative estimate of exposure that is still within the range of possible
exposures. Exposure was estimated for the the noncarcinogenic case, in which exposure is
averaged over a given exposure duration. Three routes of exposure were investigated: incidental
soil ingestion, dermal contact with soil, and soil particulate inhalation. The doses were
expressed as intakes in units of milligrams contaminant per kilogram body mass per day (mg/kg-day).
The primary parameters used in calculating intake are the chemical concentration, intake rate,
and frequency and duration of exposure. The parameters and equations used to calculate the
intakes are detailed in the following sections.
The ingestion of soil can result from placing soil-covered hands or objects (e.g., toys,
cigarettes) in the mouth. The incidental soil ingestion rate (mg/kg-day) is calculated
using the following expression:
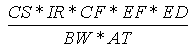
Where:
| Variable | Definition |
Assumptions | Reference |
|---|
| CS | = | Chemical soil concentration (mg/kg) |
UCL95 soil concentration |
|
| IR | = | Soil ingestion rate (mg/day) |
200 (child), 100 (adult) | EPA, 1992 |
| CF | = | Conversion factor ( 10-6 kg/mg) |
| |
|
| EF | = | Exposure frequency (days/year) |
350 (child and adult) | EPA, 1992 |
| ED | = | Exposure duration (years) |
6 (child), 24 (adult) | EPA, 1992 |
| BW | = | Body weight (kg) |
15 (child), 70 (adult) | EPA, 1992 |
| AT | = | Averaging time (years) |
6 (child), 24 (adult) |
EPA, 1992 |
Dermal contact with soil could result in the absorption of chemicals through the skin.
In accordance with EPA guidance (EPA, 1992), the dermal contact daily intake rate (mg/kg-day)
is calculated using the following expression:
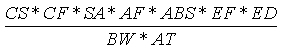
Where:
| Variable | Definition |
Assumptions | Reference |
|---|
| CS | = | Chemical soil concentration (mg/kg) |
UCL95 soil concentration |
|
| CF | = | Conversion factor ( 10-6 kg/mg) |
| |
|
| SA | = | Skin surface area (cm2/day) |
1,800 (child), 5,000 (adult) | EPA, 1992 |
| AF | = | Soil to skin adherance factor (mg/cm2) |
1.0 (child and adult) | EPA, 1992 |
| ABS | = | Dermal absorption factor (unitless) |
0.1 (organics), 0.01 (metals) | EPA, 1992 |
| EF | = | Exposure frequency (days/year) |
350 (child and adult) | EPA, 1992 |
| ED | = | Exposure duration (years) |
6 (child), 24 (adult) | EPA, 1992 |
| BW | = | Body weight (kg) |
15 (child), 70 (adult) | EPA, 1992 |
| AT | = | Averaging time (years) |
6 (child), 24 (adult) |
EPA, 1992 |
Another potential route of exposure is the inhalation of airborne soil particles. The
methodology used is based on EPA guidance (EPA, 1992) and Human Health Evaluation Manual,
Part B: Development of Risk-Based Preliminary Remediation Goals (EPA, 1991). The
particulate inhalation rate (mg/kg-day) is calculated using the following expression:
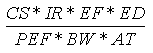
Where:
| Variable | Definition |
Assumptions | Reference |
|---|
| CS | = | Chemical soil concentration (mg/kg) |
UCL95 soil concentration |
|
| IR | = | Soil ingestion rate (m3/day) |
5 (child), 20 (adult) | EPA, 1992 |
| EF | = | Exposure frequency (days/year) |
350 (child and adult) | EPA, 1992 |
| ED | = | Exposure duration (years) |
6 (child), 24 (adult) | EPA, 1992 |
| PEF | = | Particulate Emission Factor (m3/day) |
9.26x10⁹ (child and adult) | EPA, 1991 |
| BW | = | Body weight (kg) |
15 (child), 70 (adult) | EPA, 1992 |
| AT | = | Averaging time (years) |
6 (child), 24 (adult) |
EPA, 1992 |
The toxicity of a chemical is based on its potential to cause harm to living tissue.
Noncarcinogenic toxic effects impact the development, size, or functioning of the body
or specific organs without leading to the development of malignant cells. Toxicity
values used to evaluate potential noncarcinogenic health effects are called reference
doses. Specifically, a reference dose (measured in mg/kg-day) is an estimated daily
intake level at which no significant adverse health effects occur. Since the degree of
toxicity depends on the route of entry into the body, reference doses for the ingestion,
dermal contact, and inhalation routes of exposure are different. Reference doses are
typically developed in laboratory studies which attempt to quantify the relationship
between chemical dose and adverse response. EPA has compiled reference dose data for a
wide range of chemicals and published it on the world wide web in the
Integrated Risk Information
System (IRIS) database. However, toxicological data is not available for all chemicals
and exposure routes. Due to these absences, several assumptions were made for the toxicity
assessment:
- Whereas oral reference doses are typically based on administered doses, dermal exposures
are usually expressed in terms of absorbed doses (amount that enters the bloodstream). IRIS
contains a wealth of data on oral reference doses and these were retrieved for the COCs.
However, EPA has yet published dermal toxicity values. As such, dermal reference doses
were established by extrapolation from the oral values multiplication by gastrointestinal
absorption factors: 1.0 for organics and 0.3 for metals (EPA, 1992).
- For inhalation toxicity data, values are not available for a majority of constituents.
There are two generally practiced methods to deal with this. The first is simply to not
evaluate toxicity and risk for inhalation because the uncertainty with the toxicity assessment
is too high. The second is a process called route-to-route extrapolation, in which the
inhalation reference doses are assumed to be equal to the oral doses. The latter method
was employed for this assessment.
- Of all the chemicals in the IRIS database, perhaps the least is known about PAH toxicity.
Even the data for oral toxicity is sparse. As such, PAHs for which there is no oral reference
dose were assumed to have similar toxic effects as pyrene, for which there was a published value.
Due to the need to make assumptions such as these, the uncertainties related to the toxicity
assessment can be substantial. Adding to the uncertainty question, are published reference
dose data even valid? Reference doses are typically developed using laboratory studies in
which animals are exposed to high doses of chemicals. The results are then extrapolated to
low doses in humans. What is the uncertainty in this process? Modern science has been able
to validate the procedures and results of the data reduction and exposure assessment processes
fairly well. However, the toxicity assessment remains the weak link in the risk assessment
process. As scientific advancements in the understanding of human toxicants are made, the
accuracy of the overall risk assessment process will improve.
The objective of the risk characterization is to integrate the results of the exposure and
toxicity assessments. Risk for a given chemical is measured by its hazard quotient, which
(for noncarcinogenic risk) is calculated as the intake divided by the reference dose. Since
exposure occurs simultaneously to more than one chemical, the hazard quotients are summed to
generate a hazard index for a particular exposure scenario. The hazard index for each pathway
is then summed across all pathways to produce a single hazard index value for a particular
receptor. This value is often taken to be representative of the human health risk posed by
chemicals at a site. If the hazard index is below 1, then it is generally assumed that no
noncarcinogenic adverse health effects occur. A hazard index exceeding 1 indicates that
noncarcinogenic health effects may occur. The hazard quotient and index
calculations for the American Creosote site are summarized in the following table (hazard
quotients could not be calculated for aluminum, cobalt, or lead due to the absence of IRIS
reference dose data):
RISK CALCULATION SUMMARY
| |
Ingestion |
Dermal Contact |
Inhalation |
|
|
Percent of |
| |
Child |
Adult |
Child |
Adult |
Child |
Adult |
Totals |
Total Risk |
| Organics |
|
|
|
|
|
|
Child |
Adult |
Child |
Adult |
| Acenaphthylene |
1.8E-05 |
2.0E-05 |
1.7E-05 |
9.9E-05 |
5.0E-11 |
4.3E-10 |
3.5E-05 |
1.2E-04 |
0.00% |
0.03% |
| Anthracene |
1.0E-06 |
1.1E-06 |
9.1E-07 |
5.4E-06 |
2.7E-12 |
2.3E-11 |
1.9E-06 |
6.5E-06 |
0.00% |
0.00% |
| Benzo(a)anthracene |
1.0E-05 |
1.1E-05 |
9.4E-06 |
5.6E-05 |
2.8E-11 |
2.4E-10 |
2.0E-05 |
6.7E-05 |
0.00% |
0.02% |
| Benzo(a)pyrene |
1.1E-05 |
1.2E-05 |
1.0E-05 |
6.0E-05 |
3.0E-11 |
2.6E-10 |
2.1E-05 |
7.2E-05 |
0.00% |
0.02% |
| Benzo(b)fluoranthene |
1.3E-05 |
1.4E-05 |
1.2E-05 |
7.0E-05 |
3.5E-11 |
3.0E-10 |
2.5E-05 |
8.4E-05 |
0.00% |
0.02% |
| Benzo(g,h,i)perylene |
2.0E-05 |
2.2E-05 |
1.8E-05 |
1.1E-04 |
5.5E-11 |
4.7E-10 |
3.9E-05 |
1.3E-04 |
0.00% |
0.04% |
| Benzo(k)fluoranthene |
1.1E-05 |
1.2E-05 |
1.0E-05 |
6.1E-05 |
3.1E-11 |
2.6E-10 |
2.2E-05 |
7.3E-05 |
0.00% |
0.02% |
| Chrysene |
1.2E-05 |
1.3E-05 |
1.1E-05 |
6.6E-05 |
3.3E-11 |
2.8E-10 |
2.3E-05 |
7.9E-05 |
0.00% |
0.02% |
| Dibenz(a,h)anthracene |
1.0E-05 |
1.1E-05 |
9.3E-06 |
5.6E-05 |
2.8E-11 |
2.4E-10 |
2.0E-05 |
6.7E-05 |
0.00% |
0.02% |
| Fluoranthene |
7.9E-06 |
8.4E-06 |
7.1E-06 |
4.2E-05 |
2.1E-11 |
1.8E-10 |
1.5E-05 |
5.1E-05 |
0.00% |
0.01% |
| Indeno(1,2,3-cd)pyrene |
1.2E-05 |
1.3E-05 |
1.1E-05 |
6.7E-05 |
3.4E-11 |
2.9E-10 |
2.4E-05 |
8.0E-05 |
0.00% |
0.02% |
| Phenanthrene |
9.3E-06 |
1.0E-05 |
8.4E-06 |
5.0E-05 |
2.5E-11 |
2.2E-10 |
1.8E-05 |
6.0E-05 |
0.00% |
0.02% |
| Pyrene |
1.0E-05 |
1.1E-05 |
9.3E-06 |
5.5E-05 |
2.8E-11 |
2.4E-10 |
2.0E-05 |
6.7E-05 |
0.00% |
0.02% |
| Metals |
|
|
|
|
|
|
|
|
|
|
| Aluminum |
--- |
--- |
--- |
--- |
--- |
--- |
--- |
--- |
--- |
--- |
| Antimony |
8.9E-02 |
9.6E-03 |
1.6E-01 |
9.6E-02 |
2.4E-07 |
2.1E-07 |
2.5E-01 |
1.1E-01 |
24.4% |
29.5% |
| Arsenic |
2.7E-01 |
2.9E-02 |
1.2E-01 |
7.1E-02 |
7.2E-07 |
6.2E-07 |
3.9E-01 |
1.0E-01 |
37.6% |
27.9% |
| Barium |
3.5E-02 |
3.8E-03 |
6.3E-02 |
3.8E-02 |
6.7E-06 |
5.7E-05 |
9.9E-02 |
4.2E-02 |
9.6% |
11.6% |
| Beryllium |
2.8E-03 |
3.0E-04 |
5.0E-03 |
3.0E-03 |
7.4E-09 |
6.4E-09 |
7.7E-03 |
3.2E-03 |
0.8% |
0.9% |
| Chromium |
2.4E-04 |
2.6E-05 |
4.4E-04 |
2.6E-04 |
6.5E-10 |
5.6E-10 |
6.8E-04 |
2.8E-04 |
0.1% |
0.1% |
| Cobalt |
--- |
--- |
--- |
--- |
--- |
--- |
--- |
--- |
--- |
--- |
| Copper |
6.2E-03 |
6.6E-04 |
1.1E-02 |
6.6E-03 |
1.7E-08 |
1.4E-08 |
1.7E-02 |
7.3E-03 |
1.7% |
2.0% |
| Lead |
--- |
--- |
--- |
--- |
--- |
--- |
--- |
--- |
--- |
--- |
| Manganese |
5.0E-02 |
5.4E-03 |
1.5E-02 |
8.9E-03 |
1.4E-07 |
1.2E-07 |
6.5E-02 |
1.4E-02 |
6.3% |
4.0% |
| Nickel |
1.5E-02 |
1.6E-03 |
2.6E-02 |
1.6E-02 |
3.9E-08 |
3.4E-08 |
4.1E-02 |
1.7E-02 |
4.0% |
4.8% |
| Selenium |
2.5E-03 |
2.6E-04 |
4.4E-03 |
2.6E-03 |
6.6E-09 |
5.7E-09 |
6.9E-03 |
2.9E-03 |
0.7% |
0.8% |
| Vanadium |
5.2E-02 |
5.6E-03 |
9.4E-02 |
5.6E-02 |
1.4E-07 |
1.2E-07 |
1.5E-01 |
6.2E-02 |
14.3% |
17.2% |
| Zinc |
2.6E-03 |
2.8E-04 |
4.7E-03 |
2.8E-03 |
7.1E-09 |
6.1E-09 |
7.3E-03 |
3.1E-03 |
0.7% |
0.9% |
| TOTAL |
5.2E-01 |
5.6E-02 |
5.1E-01 |
3.0E-01 |
8.0E-06 |
5.8E-05 |
1E+00 |
4E-01 |
|
|
From the summary table, it can be seen that hazard indices of 1 and 0.4 were
calculated for the child and adult receptors, respectively. Due to the many
uncertainties involved up to this point in the risk assessment, the hazard
indices were reported to only one significant digit. The highest hazard quotients
occurred in the soil ingestion and dermal contact exposure scenarios. Among the
chemicals, over 95% of the total risk was attributable to only 6 constituents:
antimony, arsenic, barium manganese, nickel, and vanadium. Interestingly, PAHs,
which are known creosote constituents, contributed very little to the overall hazard
indices. In evaluating the hazard indices, a few things should be considered:
- The calculated values could be higher than 1 and 0.4: For
this risk assessment, many chemicals were eliminated without passing through the
data reduction process. These include pesticides, PCBs, dioxins/furans, volatile
organic chemicals, and semivolatile organic compounds other than PAHs. If these
constituents were included, the hazard index would likely be higher.
- The calculated values could be lower than 1 and 0.4: The
summation of hazard quotients over all COCs assumes that noncancer effects are
additive. In reality they are not. For example, barium is toxic to the cardiovascular
system whereas manganese is known to adversely affect the central nervous system. As
such, a preferable analysis method might be to calculate a different hazard index for
each major organ/system. In addition, the RME exposure case is designed to be an estimate
of upperbound risk; hazard indices based on an average exposure case would be lower.
The steps involved in performing a credible exposure assessment are numerous. The
reliability of the results has increased over the years due the large number of studies
that have been conducted to establish the procedures and parameters used in the data
reduction and exposure assessment processes. However, as with any model, it is important
to have a good grasp of the inputs (methods, assumptions, etc.) and associated uncertainties
before attempting to use the output. Given more time, I would have liked to expand upon
this project, possibly adding some of the following steps:
- Automate the Data Reduction. Writing visual basic scripts to query the
database and perform statistical calculations would dramatically simplify the data analysis
and reduction process. It would have allowed the differentiation of soil samples based on
depth and quality control type (normal or duplicate). In addition, automation would make
possible the calculation of all chemicals (not just the initial COCs). In this manner,
cumulative risk could be evaluated.
- Include a CTE Exposure Scenario. In addition to the RME case, exposure
assessments often include a central tendency exposure (CTE) case. The CTE case is derived
using average physiological parameters and activity patterns, and is intended to provide
"average" exposure estimates. Hence, risk estimates based on CTE are more likely to apply
than RME values. The calculation process of CTE dose is identical to the RME case except
that some of the exposure parameters are changed.
- Include Ingestion of Homegrown Produce as an Exposure Route. For surface
soil contamination, this exposure route is recommended by EPA when evaluating a residential
populations as receptors. The procedure involves estimating the chemical concentrations in
produce rooted in contaminated soil. As such, development of plant uptake factors based on
chemical and soil properties would be necessary.
- Investigate Carcinogenic Risk. This would involve several steps. For the
exposure assessment, exposure would be averaged over a 70-year lifetime. In the toxicity
assessment, chemical-specific cancer slope factors would be retrieved from the IRIS database.
Excess lifetime carcinogenic risk could then be calculated by dividing intake by the slope
factor.
In closing, I would like to thank EPA Region VI and my former employer, Roy F. Weston, Inc.
for allowing me to use the site data for this term project. At their request, I've changed
some basic details about the site (name, description, etc.), but the data is real. In particular,
I'd like to thank Andy Kallus and Steve Mitchell of Weston for taking the time to answer my
numerous questions.
- EPA (U.S.Environmental Protection Agency), 1989. Risk Assessment Guidance for Superfund.
Volume I: Human Health Evaluation Manual Part A. Interim Final. Office of Solid Waste and
Emergency Response (OSWER), Washington, D.C. OSWER Directive 9285.701A.
- EPA, 1991. Human Health Evaluation Manual, Part B: "Development of Risk-Based Preliminary
Remediation Goals". OSWER Directive 9285.701B.
- EPA, 1992. Supplemental Region VI Risk Assessment Guidance. April 1992.
- EPA, 1996. Integrated Risk Information System (IRIS). EPA Toxicological Database,
Washington, D.C.
 Return to Eric Tate's home page