
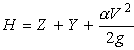
 , which states that the total energy (H) at any
given location along the stream is the sum of potential energy (Z + Y) and kinetic energy
(aV2/2g). The change in energy between two cross-sections is called head loss
(hL). The energy equation parameters are illustrated in the following graphic:
, which states that the total energy (H) at any
given location along the stream is the sum of potential energy (Z + Y) and kinetic energy
(aV2/2g). The change in energy between two cross-sections is called head loss
(hL). The energy equation parameters are illustrated in the following graphic:
Given the flow and water surface elevation at one cross-section, the goal of the direct step method is to compute the water surface elevation at the adjacent cross-section. Whether the computations proceed from upstream to downstream or vice versa, depends on the flow regime. The dimensionless Froude number (Fr) is used to characterize flow regime, where:

Henceforth, this window will be referred to as the main project window. A Project in RAS refers to all of the data sets associated with a particular river system. To define a new project, select File/New Project to bring up the main project window:

You will first need to select your working directory, and then a title (Waller Creek), and file name (Waller.prj). All project filenames for HEC-RAS are assinged the extension ".prj". Click on the OK button and a window will open confirming the information you just entered. Again click the OK button. The project line in your main project window should now be filled in. The Project Description line at the bottom of the main project window allows you to type a detailed name for the actual short Project name. If desired, you may click on the ellipsis to the right of the Description bar, and additional space for you to type a lengthy Description will appear. Any time you see an ellipsis in a window in HEC-RAS, it means you may access additional space for writing descriptive text.
For each HEC-RAS project, there are three required components--the Geometry data, Flow data, and Plan data. The Geometry data, for instance, consists of a description of the size, shape, and connectivity of stream cross-sections. Likewise, the Flow data contains discharge rates. Finally, Plan data contains information pertinent to the run specifications of the model, including a description of the flow regime. Each of these components is explored below individually.
The resulting view shows a schematic of Waller Creek from near Highland Mall to the
Colorado River. This is the main geometric data editing window. The tick marks and
corresponding numbers denote individual cross-sections. Choices under the View
menu provide for zoom and pan tools. The six buttons on the left side of the screen are
used to input and edit geometric data. The  and
and  buttons are used to create the reach schematic. A reach is simply a subsection of a
river, and a junction occurs at the confluence of two rivers. Since our reach schematic is
already defined, we have no need to use these buttons. The
buttons are used to create the reach schematic. A reach is simply a subsection of a
river, and a junction occurs at the confluence of two rivers. Since our reach schematic is
already defined, we have no need to use these buttons. The  ,
,
 , and
, and  buttons are used to input and edit
geometric descriptions for cross-sections, and hydraulic structures such as bridges, culverts,
and weirs. The
buttons are used to input and edit
geometric descriptions for cross-sections, and hydraulic structures such as bridges, culverts,
and weirs. The  allows you to associate an image file (photograph) with a
particular cross-section. Click on the button to open the cross-section
data window:
allows you to associate an image file (photograph) with a
particular cross-section. Click on the button to open the cross-section
data window:
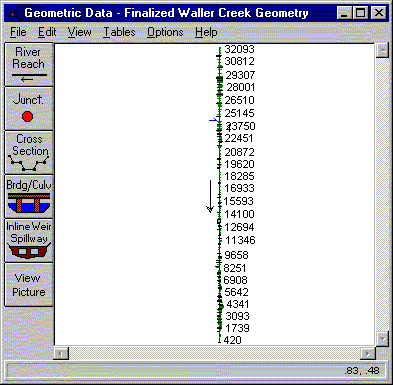
The data used to describe the cross-sections include the river station/cross-section number
(32093 in the figure), lateral and elevation coordinates for each terrain point (station &
elevation columns), Manning's roughness coefficients (nVal), reach lengths between adjacent
cross-sections, left and right bank station, and channel contraction and expansion coefficients.
These data are typically obtained by field surveys. The  buttons can be
used to toggle between different cross-sections. Use them to scroll to cross-section 26780.
To edit data, simply double-click on the field of interest. As an example, double-click on
station 779, change the value to 778, and hit the enter key. You may notice that this action
caused all of the the data fields to turn red and it enabled the "Apply Data" button. Whenever
you see input data colored red in HEC-RAS, it means that you are in edit mode. There are two ways
to leave the edit mode (you can do whichever you like):
buttons can be
used to toggle between different cross-sections. Use them to scroll to cross-section 26780.
To edit data, simply double-click on the field of interest. As an example, double-click on
station 779, change the value to 778, and hit the enter key. You may notice that this action
caused all of the the data fields to turn red and it enabled the "Apply Data" button. Whenever
you see input data colored red in HEC-RAS, it means that you are in edit mode. There are two ways
to leave the edit mode (you can do whichever you like):

The cross-section points appear black and bank stations are denoted with red. Manning roughness
coefficients appear across the top of the plot. Again, the buttons can be
used to maneuver between different cross-sections. Any solid black areas occuring in a cross-section
represent blocked obstructions. These are areas in the cross-section through which no flow can
occur. Some cross-sections contain green arrows and gray areas. This symbolism is indicative of
the presence of a bridge or culvert. Input data and plots specifically associated with bridges
and culverts can be accessed from the main geometric data editor window by clicking on the
button. Take a little time to familiarize yourself with the geometric data
by flipping through some different cross-sections and bridges/culverts. When you are finished,
return to the geometric editor window and select File/Save Geometric Data. Return to the
main project window using File/Exit Geometry Data Editor. At this point, save your HEC-RAS
project just in case the program crashes for some reason or another.
Output data from the HEC-HMS model are stored in files with a .dss extension. DSS stands for the
HEC Data Storage System, which is essentially a database for storing time-series
information. To use these data, select File/Set Locations for DSS Connections from the main
flow data window. To open the DSS file, click on the  button and select the
Waller.dss file from your working directory. The window should now look like this:
button and select the
Waller.dss file from your working directory. The window should now look like this:

The DSS data are stored in table records, each one representing a 24-hour increment of time-series flow data. Each record is described by several parameters, some of which are shown in the columns titled Part A, Part B, etc., as follows:
| Column | Description |
| A | ???? |
| B | HMS hydrologic element (subbasin, junction, etc.) identifier |
| C | Flow type (baseflow, floodflow) |
| D | Date |
| E | Model Time Step |
| F | HMS Run ID |
HEC-RAS allows you to view the hydrograph of any DSS record. Since the highest flows for our model run
occur on February 1, we'll concentrate on the data from this day. Click on any record with Column C =
FLOW and Column D = 01FEB1999 and then click on  to see the associated hydrograph:
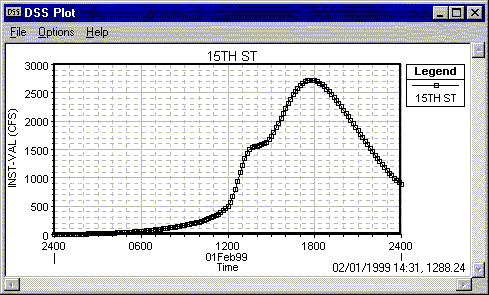
The coordinates of the cursor (time,flow rate) are displayed in the bottom right corner of the plot. Gridlines can be shown by invoking the Options/Grid menu item.
Exit the plot window and return to the "Set Locations for DSS Connections" window. We're now going to link the HEC-RAS cross-sections with their calculated DSS flows from HEC-HMS. The following table shows the relationship between the junctions in the HEC-HMS basin model and cross-sections in the HEC-RAS geometry file:
| HEC-HMS Junction | HEC-RAS Cross-Section |
| Junction with Hemphill Branch | 12609 |
| MLK Blvd | 8916 |
| 15th Street | 7089 |
| 7th Street | 3591 |
| 1st Street | 1157 |
| Colorado River | 0 |
The procedure for linking the DSS records with their associated cross-sections is as follows:
After the DSS records for the six junctions have been set, return to the main steady flow data window and select File/DSS Import. Fill in the fields as shown below:
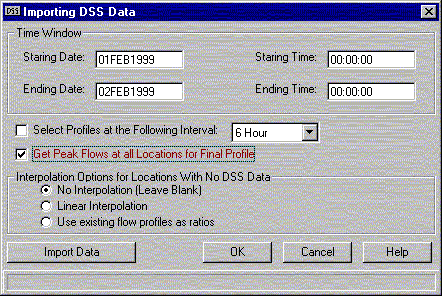
Click on the "Import Data" button, and the flows from HEC-HMS will be imported into your HEC-RAS model.
As discussed earlier, the direct step method uses a known water surface elevation (and several hydraulic
parameters) to calculate the water surface elevation at an adjacent cross-section. We'll assume a subcritical
flow regime for our model, so the computations will begin at the downstream end. As such, the water surface
elevation at the downstream boundary must be known. To establish this value, click on the
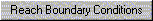 button from the steady flow data window. HEC-RAS allows the user to set the
water surface elevation boundary condition by four methods:
button from the steady flow data window. HEC-RAS allows the user to set the
water surface elevation boundary condition by four methods:
Click OK to return to the main steady flow window. You'll notice that each of the junctions have now been assigned peak flow values from the HMS DSS output. For cross-sections falling between HMS junctions, the flow value of the upstream junction is applied. However, the most upstream cross-section, number 32093, hasn't been assigned a flow value. You will need to input a number here, but its magnitude is really inconsequential because the computations will proceed from downstream to upstream (subcritical flow). And for this tutorial, we are mainly interested in water surface profiles between U.T. and the Colorado River. Input a value of 2700. All of the required flow parameters have now been entered into the model! From the file menu, select Save Flow Data and save the flow data under the name "100 year flows." To leave the flow data editor and return to the HEC-RAS project window, choose File/Exit Flow Data Editor.
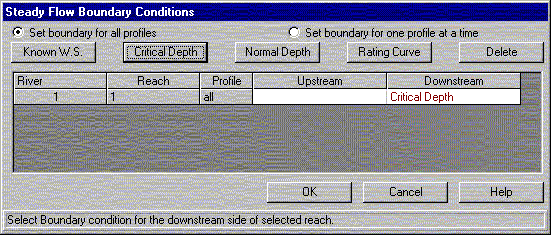
To execute the model, first ensure that the flow regime radio button is set to "Subcritical" and then click the compute button. All of the HEC-RAS windows you've used to this point are simply graphical user interfaces used to input data for the model. The computations are actually performed by a FORTRAN program named SNET. Clicking the compute button starts SNET and opens a DOS window that shows the progress of the simulation. When the computations are complete, the PROGRAM TERMINATED NORMALLY message should appear.
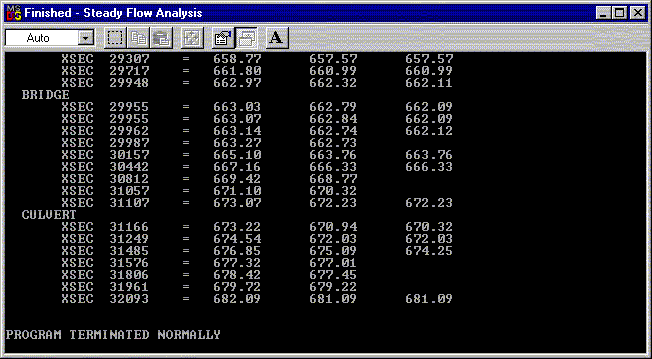
Dismiss the DOS window by clicking the X in the upper right corner.
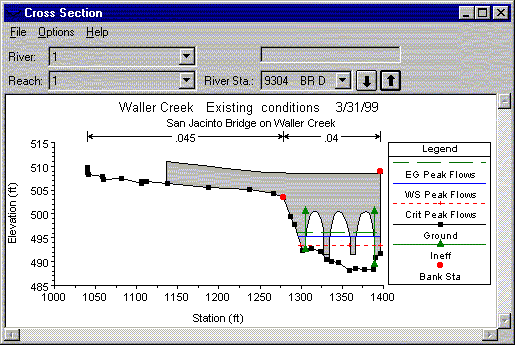
The cross-section view is similar to the one shown when we edited the cross-section data. However, the
output view also shows the elevation of the total energy head line (shown in the legend as "EG Peak Flows"),
the water surface ("WS Peak Flows"), and critical depth ("Crit Peak Flows"). As with the cross-section
geometry editor, you can use the to scroll to other cross-sections. For a profile of
the entire reach, select View/Water Surface Profiles from the project window.
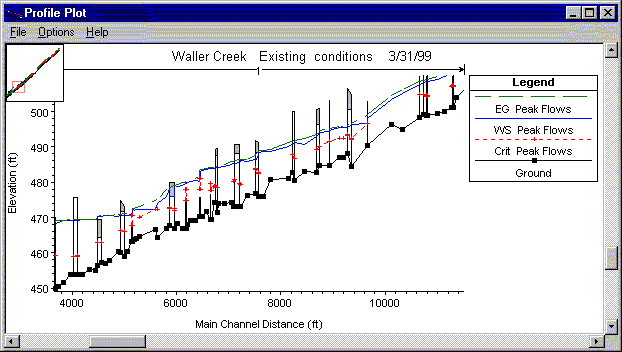
Using the Options/Zoom In menu option, you can focus on a particular stretch of reach to see how the water surface relates to structures in the channel such as bridges. Other available options for graphical display of output data include plots of velocity distribution (View/Cross-Sections/Options/Velocity Distribution) and pseudo 3D plots (View/X-Y-Z Perspective Plots). Spend a little time playing around with some of the display options.
For hydraulic design, it is often useful to know the calculated values of various hydraulic parameters. HEC-RAS offers numerous options for tabular output data display. From project window, choose View/ Cross Section Table.
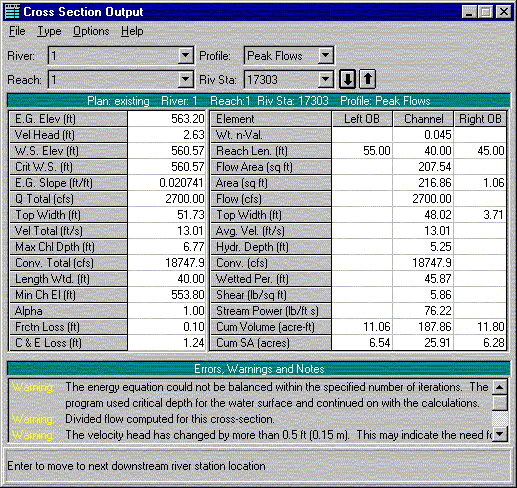
The resulting table includes a number of hydraulic parameters, including water surface elevation, head losses, and cross-sectional area. At the bottom of the window, error and notes (if any) resulting from the steady flow computations are shown. As you scroll through the cross-sections, take a look at some of the error messages. For our model, it looks like the primary areas of concern is too few cross-sections. Additional tabular output data can be accessed from the invoking View/Profile Table from the main project window. Numerous formats and data types can be viewed by selecting different tables from the Std. Tables menu.
Return to Eric Tate's home page