Geospatial Database Development for TMDL:
Building a Stream Network
Progress Report
October 28, 1999
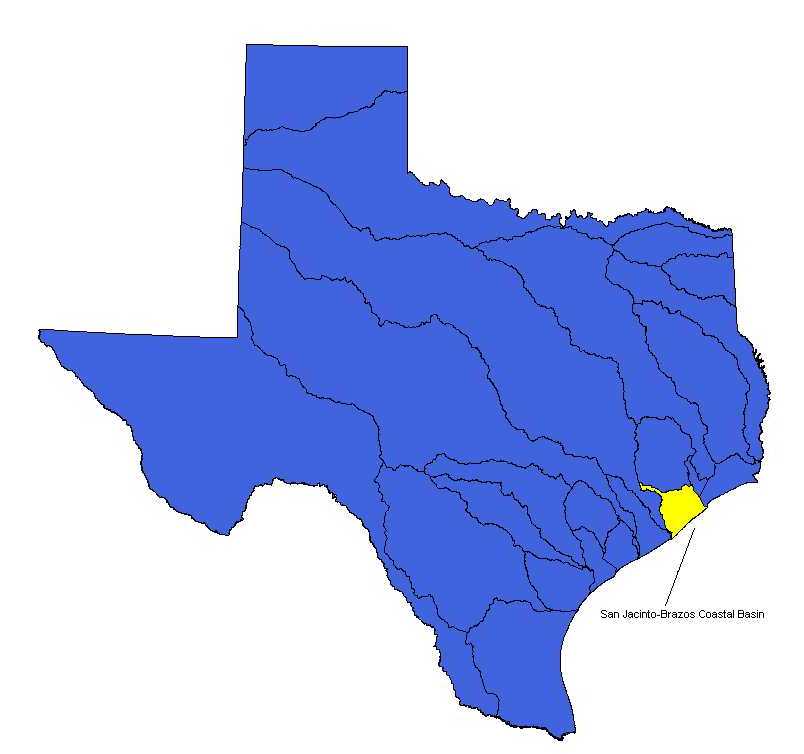
The TNRCC has funded research by the Center for Research in Water Resources to develop a geospatial database for TMDL, a method of analyzing the water quality of designated segments, for the coastal region of Texas near Houston. This project performs the beginning steps of this research. Specifically, I chose to focus on the San Jacinto-Brazos coastal basin, and develop the stream network and delineate the watersheds with respect to water quality segments. The procedure that I have followed thus far is as follows:
I first identified the San Jacinto-Brazos Coastal Basin, highlighted in yellow. It is comprised of two Hydrologic Unit Codes (HUCs), designated by the USGS. These are #12040204-West Galveston Bay, and #1204205-Austin-Oyster.
 Focusing
on the San Jacinto-Brazos basin, I then looked at the RF3 files, supplied by
the EPA. These files categorize each stream reach in the nation with a
letter type. This stream network is obviously too dense for my purposes
and must be narrowed down to relevant stream reaches. Additionally, the
RF3 files do not represent all features as single lines. These features
cannot be used and must be changed to single lines.
Focusing
on the San Jacinto-Brazos basin, I then looked at the RF3 files, supplied by
the EPA. These files categorize each stream reach in the nation with a
letter type. This stream network is obviously too dense for my purposes
and must be narrowed down to relevant stream reaches. Additionally, the
RF3 files do not represent all features as single lines. These features
cannot be used and must be changed to single lines.
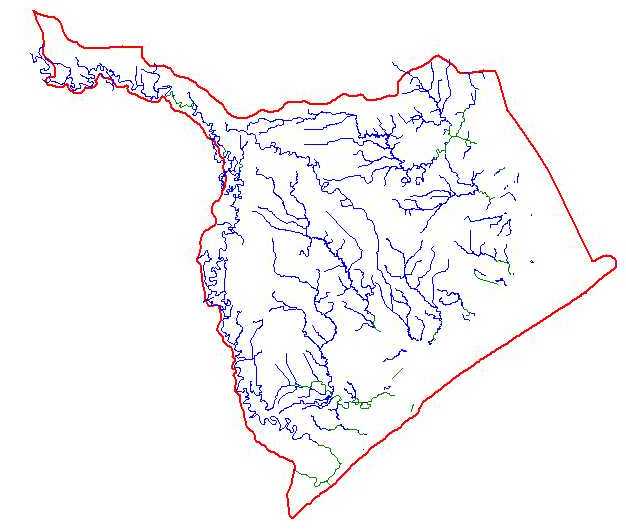
The acceptable river reaches are then selected by a query for those labeled as R (regular reach, with upstream and downstream reaches connected to it), S (start reach, a headwater reach with 1 or 2 reaches downstream) or T (terminal reach, reach with no downstream reach and 1 or 2 upstream reaches). These reaches are then converted to a new shapefile. The USGS also has centerline coverages of some of the irregular water features that are represented by unacceptable RF3 labels. These centerlines are then merged with the R, S, and T streams using the Geoprocessing Wizard in ArcView under the View Menu. The resulting stream network is shown above, much less dense then the original RF3 network.
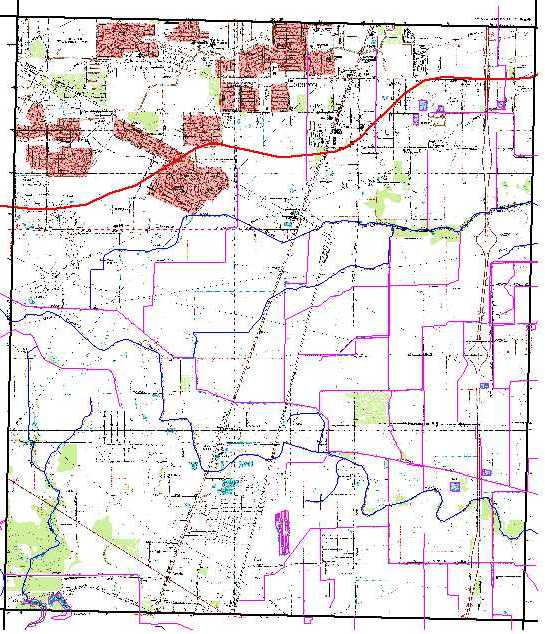
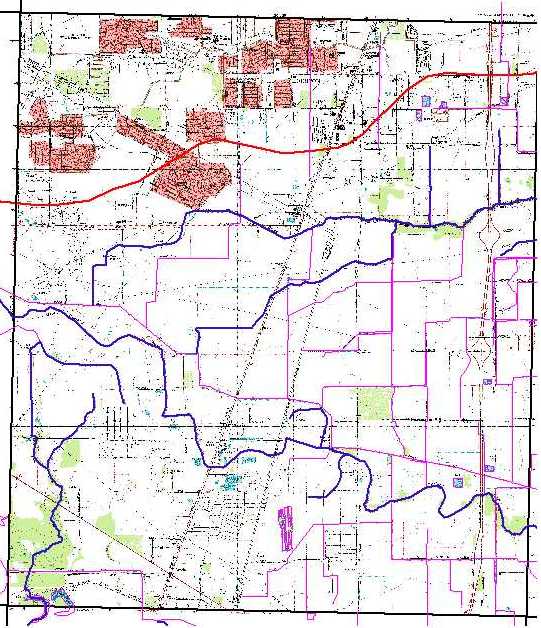
The basin must then be looked at closely, looking at the RF3 reaches, and comparing them with the new acceptable network. Centerlines and reaches must then be added manually to the network. Digital Raster Graphics (DRGs) are loaded beneath the reach data to help display the natural features of the basin. They are added using a hot link with a script (AddTopo) written by Jona Finndis Jonsdottir. The following graphics show a closeup of a quadsheet with only RF3 data and the same quadsheet with the stream network that will be used. Note the differences between stream reaches that were added and those that were left out. The purple lines are RF3 data and the blue lines are the acceptable stream reaches.
 |
 |
The resulting river network, after manually adding centerlines and reaches looks like:
Future work now includes:
checking the connectivity of the merged centerlines and R, S, and T reaches
adding additional reaches to represent the vast canal network
deal with the complications of being located along the coast
use the CRWR-PrePro menu to delineate the watersheds
