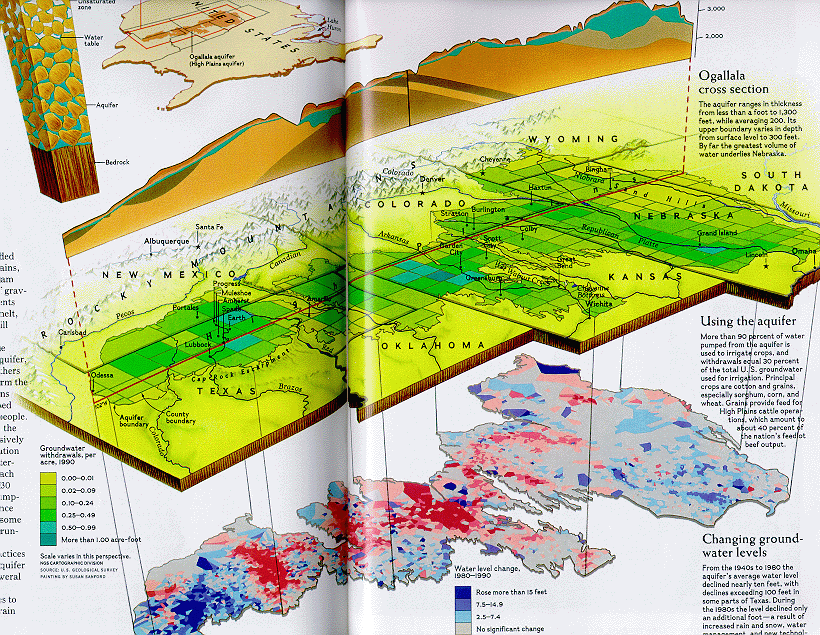

The top view shows the Ogallala cross section and aquifer thickness.
The middle view shows the groundwater withdrawals per acre for 1990 with blue representing withdrawals of more than 1 acre-foot.
The bottom view shows the water level changes in the aquifer from 1980 - 1990. Gray represents no significant change. Dark red refers to declines of more than 15 ft. while dark blue refers to rises of more than 15 ft.
(Zwingle 84-85)