Name:__Key________________
GIS
in Water Resources Midterm Exam
Fall 2006
There
are 4 questions on this exam. Please do all 4.
1. [20 points] Geodesy,
Map Projections and Coordinate Systems
Below are the spatial reference properties of the DEM used for hydrologic analysis in Exercise 4.
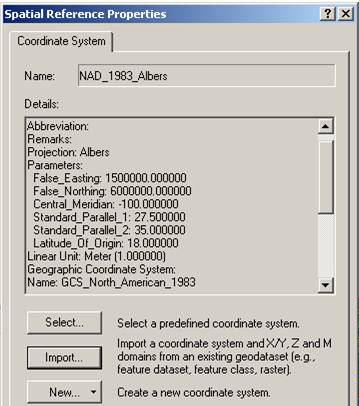
a) What horizontal earth datum is used?
North
American Datum of 1983
b) What
map projection is used? Why is this particular projection used for this exercise?
Albers equal area, it preserves earth
surface area which is important for mass balances
c) What
are the geographic coordinates of the origin (φo, λo)?
(18,00° -100.00°)
d) What
are the projected coordinates of the origin (Xo,
Yo)?
(1500000,
6000000)
2. [25 points]
Distances on a Curved Earth
Logan,
Utah is located at 41°44'N, 111°50'W.
Austin,
Texas is located at 30°11'N, 97°40'W.
a)
Convert these coordinates to decimal degrees and indicate which of these
numbers represents longitude and which represents latitude by filling the
corresponding decimal degree longitude and latitude into the following table
|
Cities |
Longitude
|
Latitude |
|
Logan |
-(111+50/60) = -111.8333o |
41+44/60 =
41.7333o |
|
Austin |
-(97+40/60) = -97.6667o |
30+11/60 =
30.1833o |
b)
Assume
a spherical earth with radius of 6370 km. Calculate the distance
from Logan (Utah) to Austin (Texas).
r=earth radius = 6370 km
f1, f2, are the latitudes, 41.7333ºand 30.1833º respetively
l1, l 2, are the longitudes. l 1 - l 2 = -111.8333- (-97.6667) = -14.1666º
![]()
![]()
![]()
![]()
Now Cos-1(0.9602) = 16.22199 º but we need
the result in radians, so 16.22199*π/180 = 0.2831 radians, so
![]()
Evaluating the formula d=1803 km
c)
Discuss some other ways that you have learned for calculating the distance from
Logan to Austin that are not limited to assuming a spherical earth and describe
how you would go about calculating this distance more precisely. (What we are looking for here is a
description of how you would do this, using the GIS knowledge and tools you
have learned. You are not expected to do
it in this question.)
One way is to project the locations into a GIS spatial reference, preferably chosen to minimize distance distortions then calculating the distance based on projected coordinates. This does however involve some level of distortion associated with the projection. A more precise approach is to use the ellipsoid that underlies the horizontal datum used to define the coordinates. The distances on a curved earth handout provided a matlab script that implemented ellipsoid calculations.
3. [30 points] Hydrologic Variables derived from DEM’s
Following is a grid of elevations. Because in general it is not possible to unambiguously determine flow directions around the edges, these have been specified for you as indicated.
a) On the above grid, determine which grid cells are pits and indicate the elevation to which they need to be raised to fill them.
b) Determine the flow direction grid using the 8-direction pour point method (D8) for the 9 internal grid cells. Indicate the flow direction by using an arrow in each cell on the grid below.
c) Determine the flow accumulation grid corresponding to the D8 flow directions. Label each cell on the grid below with the number of upstream cells draining into it (ESRI convention).
d) On the above flow accumulation grid, map the streams corresponding to a flow accumulation threshold greater than or equal to 5.
e) Assume that these are 30m grid cells and that the mean annual rainfall over this area is 750mm. Consider that on grid cells that are streams (as determined by the theshold of 5 cells above) all the rainfall becomes runoff, but that on grid cells that are not streams 80% of rainfall is lost through evapotranspiration and infiltration and only 20% of rainfall becomes runoff. Determine mean annual flow into grid cell A in m3/year.
There are 11 grid cells that drain in to
A. 9 (light shading) are not on the
stream. 2 (dark shading) are on the
stream. From the on-stream cells flow is: 2 * 750 mm * 900 m2 /1000 mm/m
= 1350 m3 From the off-stream cells flow is: 9 x 750 mm * 0.2 * 900 m2 /
1000 mm/m = 1215 m3 Combining, the flow is: 2565 m3/year

4. [25 points] ArcHydro Catchments and
Networks.
Following are subsets of the “Catchment”, “DrainageLine” and “Drainage Point” feature classes derived using Arc Hydro.
14 19 135 140 138 131 128 26 13 10 416


![]()

413 412 424 423
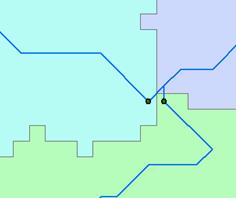
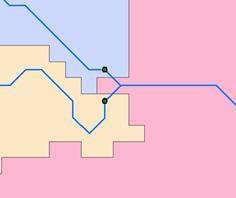
The drainage points have each been labeled with their HydroID. Following are the corresponding attribute tables. The units are km for length and km2 for area.
|
Drainage Point
|
DrainageLine
|
Catchment
|
OID |
Shape_Length |
Shape_Area |
HydroID |
NextDownID |
|
1 |
162 |
437 |
10 |
13 |
|
2 |
99 |
177 |
14 |
13 |
|
3 |
52 |
69 |
19 |
18 |
|
4 |
76 |
94 |
13 |
19 |
|
5 |
46 |
392 |
26 |
19 |
a) On the map above (on the previous page) label each DrainageLine and Catchment with its HydroID
DrainageLine HydroIDs are labeled in red text with black border. Catchment HydroIDs are black text with no border.
b) Report the area of the Catchment that drains to the point with HydroID 423.
HydroID 423 in the drainage line table has DrainID
= 13 which points to the HydroID field in the catchments table. For the catchment with HydroID = 13, A = 94 km2
c) Evaluate the total length of drainage lines draining to the point with
HydroID 423
Length HydroID-135 + Length HydroID-131 + Length HydroID-128
L = 17 + 26 +57 =
100 km
d) Evaluate the total area of the watershed draining to the point with
HydroID 423.
Area Hydro ID-10 + Area Hydro ID-14 + Area Hydro ID-13
A = 437 + 177 + 94
= 708 km2
e) Evaluate
the drainage density of the watershed draining to the point with HydroID 423
D = Length/ Area =
100/708 = 0.141 km/ km2