CE 394K.3 Final Exam Fall 2005
GIS in Water Resources
There
are three questions on this exam. Do
all three questions. For the first two
questions, prepare a 2-page typed theme paper.
For the third question use ArcGIS to prepare the map and answers
requested. Staple all three solutions
together in the order of the questions, and turn in the result to Dr. Maidment
or give to the EWRE Area Secretary in ECJ 8.612 by 5PM on Friday, December 16. This is a take-home exam. You are honor bound not to discuss this exam
with your colleagues in the class. Your
answers should be the result of your work and thought alone. Be assured that if essentially the same idea
appears in answers from more than one person, it is fairly easy to recognize
that when the grading is being done. If
that happens, it is not clear from whom the idea originated and who is just
using somebody else’s knowledge. So,
keep your ideas to yourself!
The
term papers that you choose to describe in answering Questions 1 and 2 should
be mutually exclusive, that is, if you focus on particular term papers in
answering one of the questions, don’t focus on the same papers when answering
the other question. The
What
I am looking for in grading your answers to the first two questions is:
·
Knowledge of the facts. Make sure you lay out the facts of what has
actually been done before you start offering opinions about what could have or
should have been done. This particularly
applies to the discussion of term papers.
Make sure you discuss what was actually done in the term paper not just
about the general subject itself.
·
Thoughtful evaluation. How do you evaluate the advantages and
limitations of the principles, methods and data that have been used? How does the knowledge you’ve learned in
this class relate to the world around us?
I am looking for a sense of reflection here, of seeing you set
individual situations and facts in a larger context in an intelligent way.
Questions
1. Compare and Contrast Two Applications Dealing with the same Theme
Choose
two term papers that deal with the same or similar themes or topics. Neither of these papers should be your own
term paper. Briefly summarize the
contents of the papers (the problem examined, the method of analysis, the
results achieved). Compare and contrast
the approaches to the problem that the two papers took. Which technical approach do you think was
more effective? Why? Which paper does a more effective job of
communicating its results? Why? Suppose you were undertaking a study of this
same subject. Having studied these two
papers, what have you learned about how to go about your investigation
effectively? What would you do
differently from what the authors of these papers did?
2. Write an
Assessment of the Utility of GIS in a Particular Application Area
Student
term papers on a range of topics have been presented. Select four papers that fall within a similar
subject area and present a critique of how effective GIS is in its application
in this subject area. What is the scope
of the application area? How has GIS
been used? What types of problems have
been solved effectively? What
limitations exist that have yet to be overcome in the application of GIS in
this area? In your answer, you must refer specifically
to work presented in term papers prepared in this course. In other words, I am not looking here just
for a general statement about your opinions in the field but rather a deduction
based on the term papers presented in this class of what has been done and how
you judge the effectiveness of that. At
least one of the papers should be from each of the participating Universities
(i.e. you may choose thee papers from Texas and one from Utah, two from each or
one from Texas and three from Utah, but not all from the same University.).
3. Potential
Background and Context. The map following
shows the location of
Question. The zip file http://www.ce.utexas.edu/prof/maidment/giswr2005/final.zip
contains the digital orthophoto quadrangle images used in the figure and the
national elevation dataset digital elevation model for this region. I have also unzipped these data so that you can
reach them directly if you use the LRC computers. The unzipped files are at civil.ce.utexas.edu/class/Maidment/giswr2005/final.
Use this data to perform a potential
flooding analysis of Salt Lake City Airport and North Salt Lake City.
 Figure
1. Transportation Infrastructure and
Urbanization adjacent to the
Figure
1. Transportation Infrastructure and
Urbanization adjacent to the 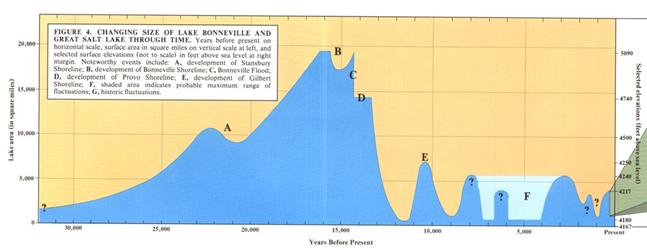
Figure 2.

Figure 3. Recorded
a) Give the geographic projection of the data
provided in the zip file.
b) Manually create two polygons that demarcate
the
Figure 4.
c) Use the National Elevation Dataset digital
elevation model to determine the mean, minimum and maximum elevation in the
Airport and NSLC polygons.
d) Suppose that the lake were to rise to a level
of 1286 m (4219 ft). Calculate the area
within the Airport and NSLC polygons that would be flooded. Report the average depth of flooding in each
of these polygons.
e) Prepare a nicely formatted layout map that
depicts the extent of flooding of this area should the lake rise to the level
of 1286 m.