The Influence of Freshwater Inflow on Macroinvertebrate Species
Composition
In
Julie Kinsey, University of Texas,
Marine Science Institute, 2004
Purpose
of Project
For my project, I
attempted to show spatial and temporal changes in dominant benthic species
composition in
Study Area
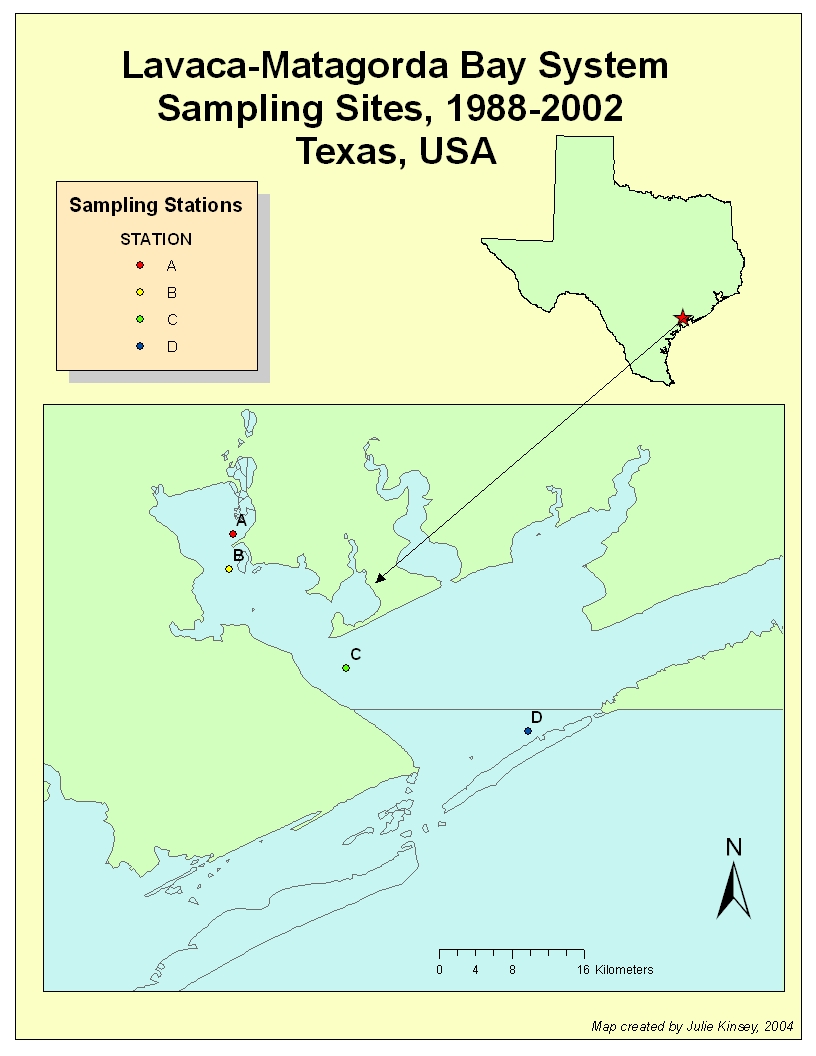
Map of the
Lavaca-Matagorda Bay System, with barrier islands included. The shapefiles I
used to create the map were obtained from the National Hydrography Dataset
(NHD), http://nhd.usgs.gov/data.html.
These shapefiles could not be merged in such a manner that I could remove the
lines in between them. Also, the barrier islands were classified differently
than the mainland, thus I could not color them in with the same color as the
mainland. I chose to use the ESRI Texas shapefile for the rest of my maps to
present a “cleaner” look.
Background
The Benthos
& Inflow
Historical studies
have stressed the importance of freshwater inflow to estuarine systems, and its
status as a major factor in proper estuary functioning and health has long-been
established in many coastal areas across the globe, including those along the
Benthic macroinvertebrates are established indicators of water quality in both freshwater and marine systems, and can highlight different aspects of the environment, including pollutant levels, hypoxia/anoxia, turbidity, salinity changes, and more (Oglesby 1967, Merritt and Cummins 1984). Relatively sessile and long-lived, benthic macroinvertebrates can reveal temporal changes in the environment that simple hydrographic measurements and chemical analysis can either not determine, or are impractical to utilize because of sizeable monetary and time constraints. Ubiquitous and relatively inexpensive to collect and analyze, these macrofauna (>0.5mm) are excellent tools in assessing both short- and long-term environmental conditions.
An integral part of the trophic structure in estuarine environments, soft-bottom dwelling macrofauna species possess a wide range of stress tolerances, including varying sensitivities to changes in salinity (Kalke and Montagna 1989, 1991, Longley 1994). Thus, they are not only important members of the estuarine community, but are also extremely useful in assessing the effects of freshwater inflow in estuarine systems, where salinity gradients can vary dramatically over time. These shifts can occur both rapidly and over long periods.
While many early studies in regional
Because freshwater inflow and salinity play such a major roles in benthic community structure, it is important to understand the effects of freshwater inflow within and among different estuaries in order to properly manage these systems.
Species
Dominance in
In the sites that I studied, two particular species generally dominated, Streblospio bendecti and Mediomastus ambiseta. The polychaete S. bendecti is a pioneering species that can respond quickly to disturbances in the environment. A suspension-feeder, it is generally found in the first 3 cm of the substrate. Mediomastus ambiseta, an equilibrium species, is a subsurface deposit-feeding polychaete that can be found in both the first 3 cm of the substrate, as well as below in the 3-10 cm range (Kalke and Montagna 1989, Martin 1994). Both species have wide tolerance ranges for changes in salinity. When other species are strained or killed by hypersaline conditions, both can survive and dominate. They can also dominate at higher inflows, as well. Streblospio benedicti can proliferate rapidly after significant disturbances, while M. ambiseta is most often able dominate after conditions stabilize.
Chironomid larvae are freshwater species that are found in the bays after relatively high inflows have occurred. They indicate that a moderate to large inflow has occurred in the recent past, even if they are found during a sampling period when inflow was low.
Macroinvertebrate
species data was obtained from my advisor, Dr. Paul Montagna (
Original
Intent for Project
My original intent was to track changes in dominant species over time using the Tracking Analyst Program. Unfortunately, it posed a variety of problems that would not allow this, including:
- On the map itself: Would not “play” all the dates in an animation loop. You had to “scroll” through them one-by-one to show them all.
- If you created an animation file, it would also not include all the dates.
- Also, the main problem was that it would not let me show more than one variable at a time (such as inflow, species dominance, etc.). Normally, you can highlight more than one variable at a time, but the temporal layer created by the program would not allow it. For my map animation to be interesting, I would need to pair freshwater inflow with species changes, as well as the presence or absence of freshwater species.
- There IS a feature that allows you to symbolically highlight certain events (such as freshwater inflow above or below a certain level, and the presence of freshwater species), but once the feature appeared, it would not disappear from the map on dates when freshwater species were absent.
A Still from my Animation:
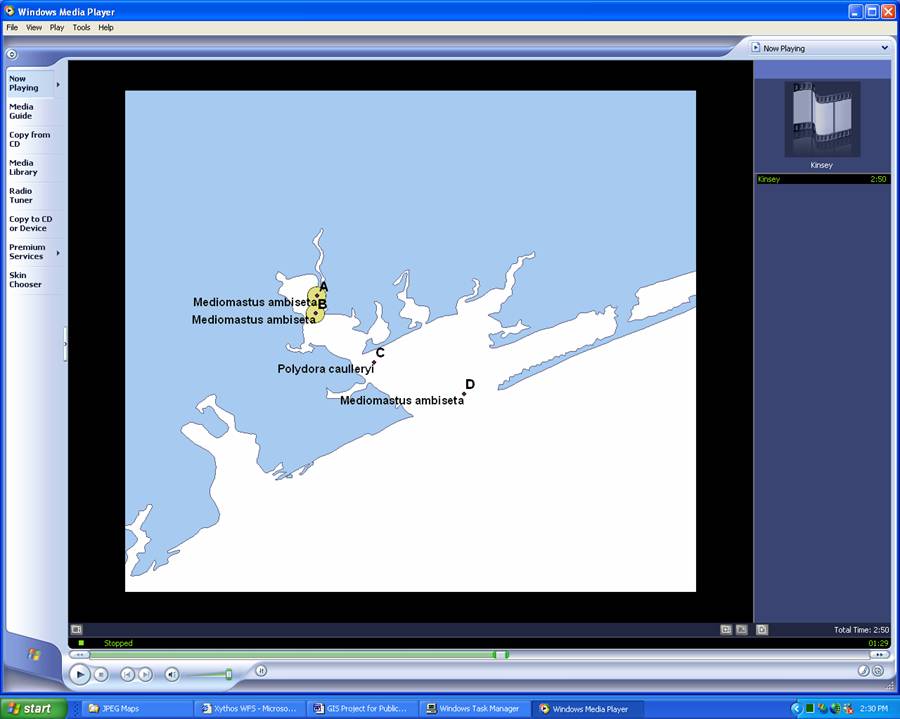
The text in the
animation would only feature the species information, and would not include
date or inflow, which was necessary in order for the map to make sense and/or
be useful. The presence of chironomid larvae (a freshwater species) was
symbolized by the yellow circles, but they would not disappear from the map on
subsequent dates when freshwater species were absent.
*To effectively show how species changed with inflow
through time, I ended up creating a series of maps that highlighted the most
interesting changes.
*Note: In general, the flow rates are calculated from the month previous to the sampling date to allow
for a lag in response time that is typical of most benthic species. However,
some months in my study were sampled towards the end of the month, and benthic
species have responded to inflows during
that month. In this case, inflows from the sampling month are used, and are
noted as such.
7.31.90: Flow Rate: .72cfs 6/90
26.3cfs on 7/90
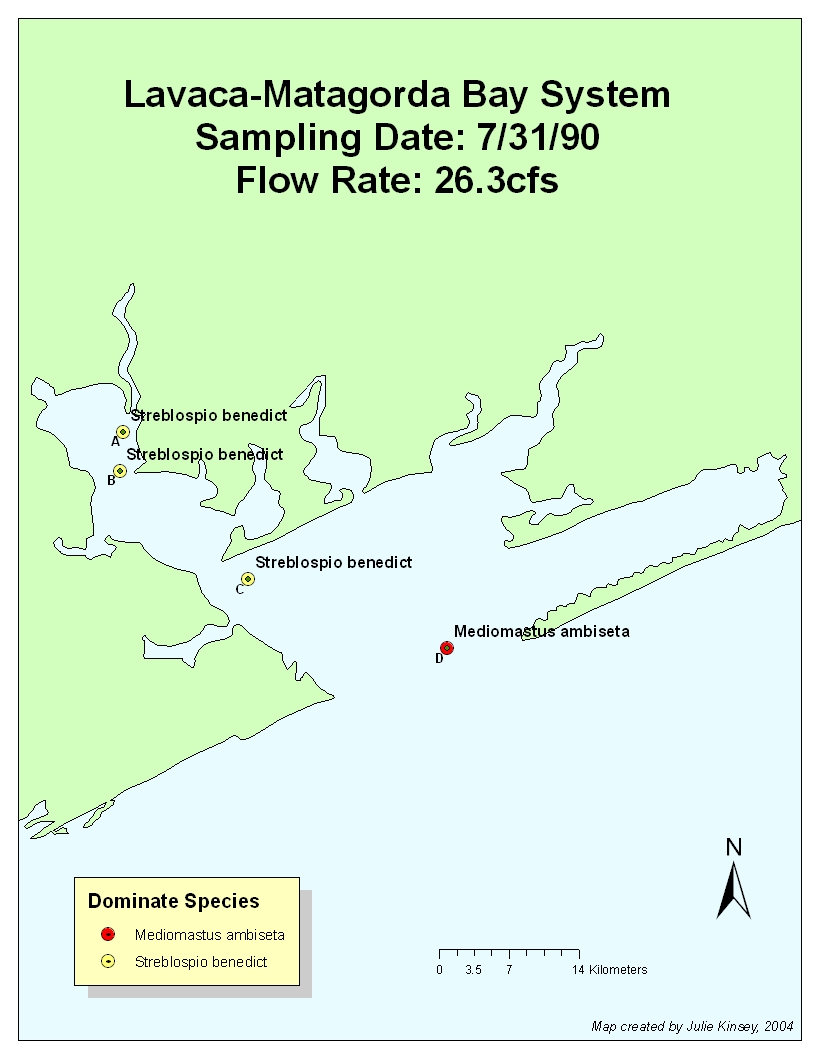
M. ambiseta was dominant at all stations on the previous sampling
dates in Jan and Apr, and low inflows in June most likely accounted for the
fact that it was not displaced prior to the July sample. A low-to-moderate
pulse of inflow occurred during the sampling month (26.3 cfs), displacing M. ambiseta. Streblospio benedicti dominated
at sites A-C in July, but inflows were not large enough to displace M. ambiseta at station D (the station under
the most tidal influence).
4.24.91: Flow Rate: 33.2cfs 3/91
1388cfs on 4/91
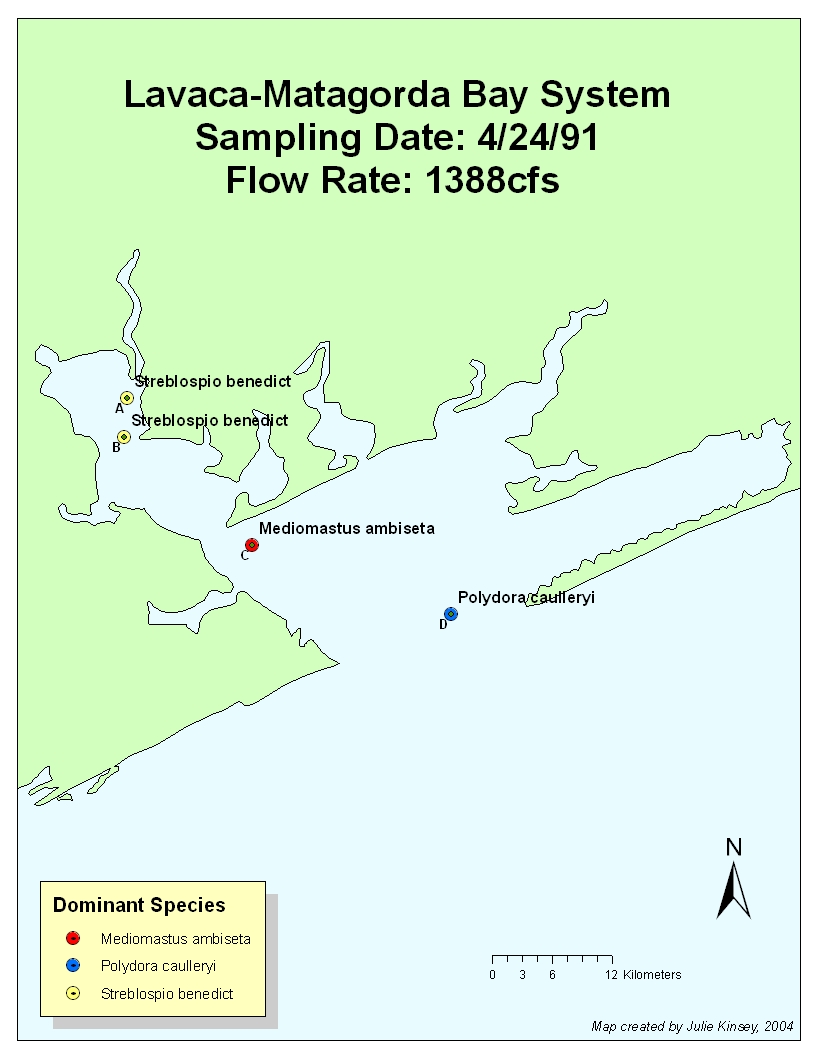
During
April of 1991, an entire species shift occurred. The upper reaches that contain
sites A & B most likely shifted due to moderate disturbance by the 1388cfs
inflow during that month. However, the inflow had not yet reached station D,
which shifted to a climax community because of stable, low-flow conditions. We
can extrapolate this because the polychaete Polydora
caulleryi is known as a late-successional (i.e. climax) species that
prefers higher salinities. The previous month had moderately low inflow (as did
January), and the dominant species was M.
ambiseta at Stations B-D (S.
benedicti was dominant at station A).
7.24.91: Flow Rate: 71.7cfs 6/91; 160 cfs 7/91
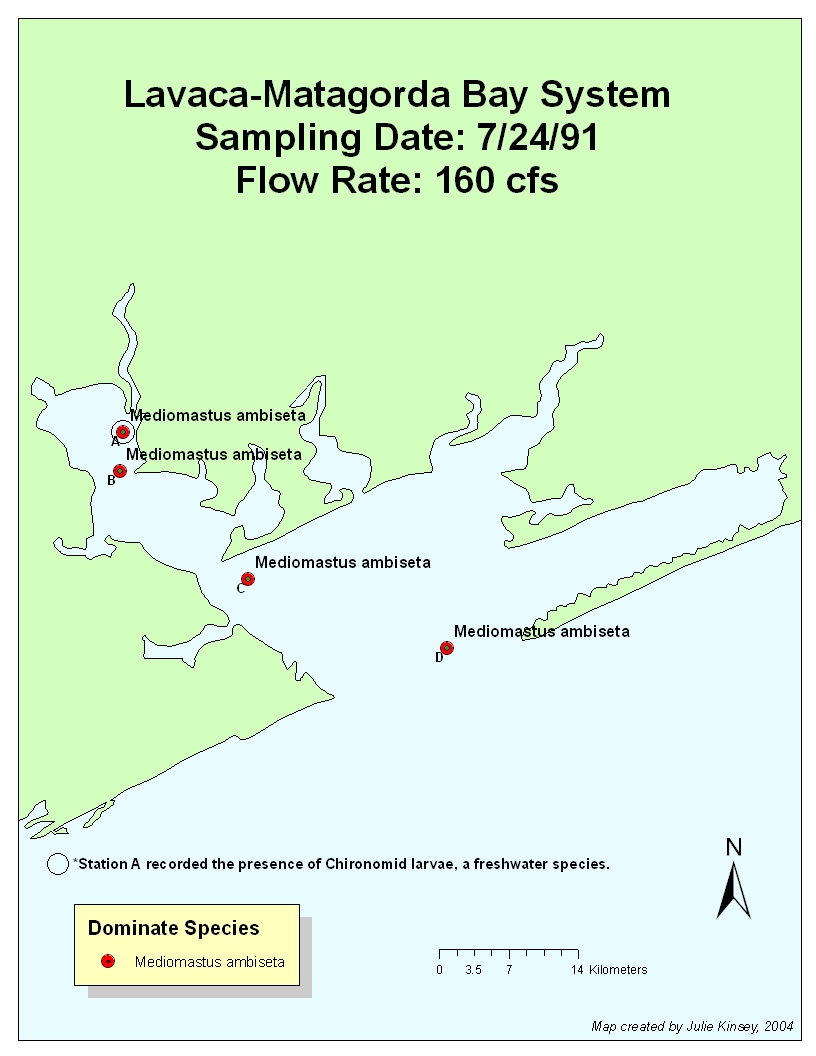
Inflow
rates were relatively low up until this point, except for the moderate inflow
pulse in April. Mediomastus ambiseta dominated,
most likely because system had once again stabilized (P. caulleryi was probably displaced due to lowered salinities from
April’s pulse). However, chironomid larvae were found, their presence presumably
caused by the April inflow event. They probably did not appear until July’s
sampling date because of travel time (i.e. the pulse did not immediately carry
them as far as site A in April) and lack of
very high flushing rates in the spring.
This is a good example of how we can track changes in inflow using
bioindicator species. Even though the flow rate was relatively low just before
and during the sampling period, we can tell that there was a significant amount
of freshwater inflow into the system in the recent past, as evidenced by the
presence of freshwater species.
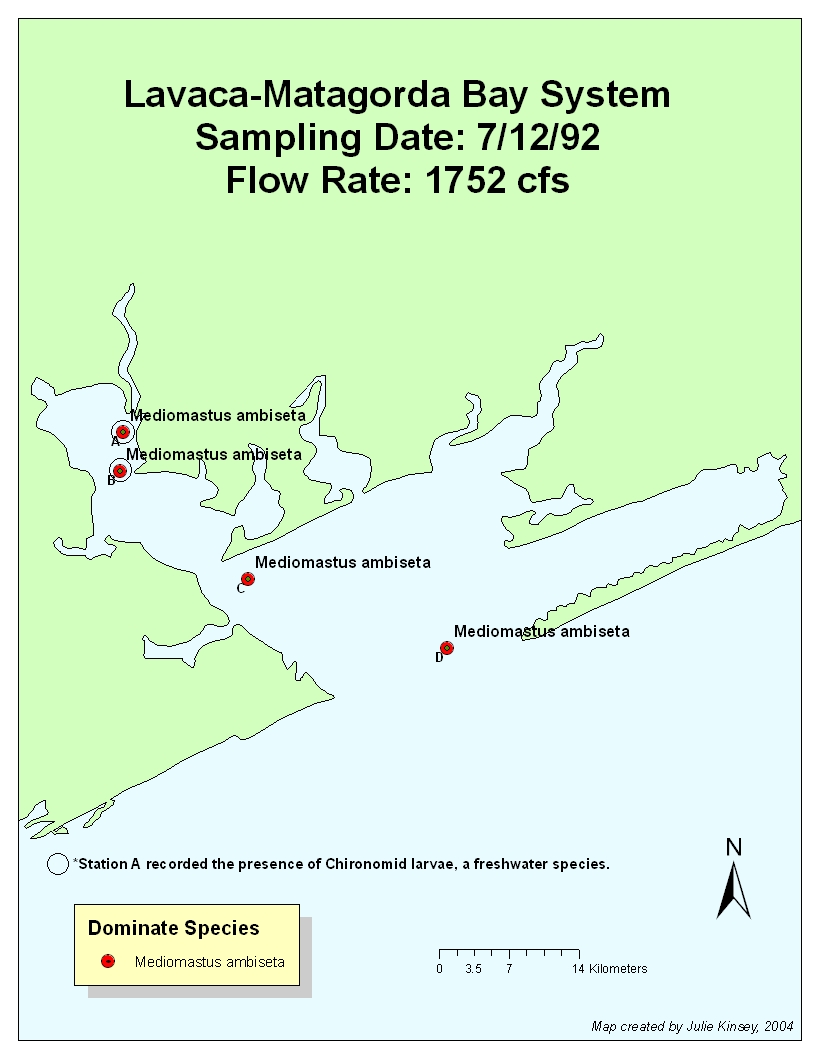

The
flow rate was high for first six months of 1992. It was probably too high to
allow S. benedicti to dominate due to
the fact that the upper layer where S.
benedicti is found was constantly being turned over. Chironomid larvae were
found at Stations A & B due to copious amounts of freshwater inflow. By the
October sampling date, the flow rate had stabilized to 32.4 cfs in 9/92 (35.8
in 10/92), yet chironomid larvae is still found at Station A. Thus, the effects
of freshwater inflow (and the fact that it occurred previously in the year) can
still be witnessed, even though flow rates just before and during the sampling
period were low.
Methods
·
To produce my
initial map, I used National Hydrography Dataset (NHD) shapefiles and an ESRI
shapefile of
·
I made my own
shapefile for sites A-D by creating a .dbf table with lat/long coordinates
(converted into decimal degrees), importing it into an ArcMap document, and
then setting the XY coordinates.
·
I made sure that
all shapefiles were projected in WGS 1984 (my original coordinates from my GPS
unit were in WGS 1984).
·
To highlight
species changes, I labeled dominate species with their respective names, and
then changed the symbology to reflect the different species (all this was done
in the “Properties” section of the shapefile).
·
I used Tracking
Analyst to create an animation (.avi) file. (See the “Original Intent…” section
of this webpage for problems associated with using TA).
·
After I realized
that the TA program would not work for my data, I created a series of maps
highlighting the most interesting temporal data that I had obtained.
Statistics
|
Species Key for Graph |
|
|
Dominant Species |
Species Number |
|
Streblospio benedicti |
2 |
|
Rhynchocoela (unidentified) |
8 |
|
Polydora caulleryi |
5 |
|
Oligochaetes (unidentified) |
11 |
|
Mulinia lateralis |
6 |
|
Minuspio cirrifera |
7 |
|
Mediomastus ambiseta |
1 |
|
Lepton sp. |
9 |
|
Cossura delta |
10 |
|
Apseudes sp. A |
3 |
|
Ampelisca abdita |
4 |
Somewhat surprisingly, no significant relationship was
found between dominant species and inflow rates (Sigma Plot). This, however,
does not mean that the data is not important. It should be noted that we can
see a definite difference between the most dominant species, M. ambiseta and S. benedicti and the rest of the species. The most evident pattern
is that M. ambiseta and S. benedicti dominate during all levels of inflow. However, the
dominant species that occur more rarely are only found when inflows range from
approx. 0-1700 cfs, and disappear after moderate- to high-inflow events (with
the exception of M. cirrifera and Apseudes sp. A, which were found only
once each during high flow events). The rarely dominant species reappear after a disturbance, while the
pioneering and tolerant species are always present during a disturbance. This indicates successional community
dynamics, whereby different species respond to varying disturbance regimes. In
other words, there is a temporal relationship between which species will
colonize an area with respect to when a disturbance has occurred. Species such
as S. benedicti can quickly colonize
an area after a disturbance, and M.
ambiseta can tolerate a large variety of disturbance regimes, but generally
dominate after disturbances occur. The other species generally occur when a
community has been stable for a longer period of time.
Other Factors
Inflow and Salinity are important,
but so are:
l
Sediment type
l
Nutrient loading
l
Mechanical/chemical
disturbances, etc.
These secondary factors not
within the scope of this project
Importance of Study
Determination
of minimum inflows is necessary to preserve the health of the estuarine and
surrounding coastal ecosystems. Because freshwater inflow and salinity play
such a major roles in benthic community structure, it is important to
understand the effects of freshwater inflow within and among different
estuaries in order to properly manage these systems.
Acknowledgements
I’d like to extend
my special thanks to Dr. Paul Montagna, Marc Russell, Harris Muhlstein, Rick
Kalke, and Dr. David Maidment for their help in creating this project.
Sources & Literature Cited
Atrill, M.J., S.D. Rundle, and R.M. Thomas. 1996. The influence of drought-induced low freshwater flow on an upper-estuarine macroinvertebrate community. Wat. Res. 30 (2); 261-268.
Baird, C., M. Jennings, D. Ockerman, and T. Dybala. 1996.
Characterization of
Chapman, E.R. 1966. The
Engle, V.D. and J.K. Summers. 2000. Biogeography of benthic
macroinvertebrates in estuaries along the
436: 17-33.
Kalke, R.D. 1981. The effects of freshwater inflow on
salinity and zooplankton populations at four stations in the Nueces-Corpus
Christi and Copano-Aransas Bay systems, TX from October 1977-May 1975. In: R.D.
Cross and D.L. Williams (eds.), Proceeding of the International Symposium on
Freshwater Inflow to Estuaries.
Kalke, R.D. and Montagna, P.A. 1989. A Review: The Effect of
Freshwater Inflow on the Benthos of Three
No. TR/89-011. 370 pp.
Kalke, R.D. and P.A. Montagna. 1991. The Effect of
Freshwater Inflow on Macro-benthos in the Lavaca River Delta and
Longley, W.L. (ed.). 1994. Freshwater inflows to
Mannino, B. A. and P. A. Montagna. 1994. Effects of
Freshwater Inflow and Sediment Characteristics on Small Scale Spatial Variation
of Macrobenthic Community Structure in
Martin, C. 1994.
Montagna, P.A., R.D. Kalke, and C. Ritter. 2002. Effect of
Restored Freshwater Inflow on Macrofauna and Meiofauna in Upper
National Hydrography Dataset (NHD), http://nhd.usgs.gov/data.html
Oglesby, R.T. 1967. Biological and physiological basis of
indicator organisms and communities: Section I – Biological basis, p. 267-269.
In: T.A. Olson and F.J. Burgess (eds.), Pollution
and Marine Ecology. Interscience Publishers,
United States Geological Survey (USGS), http://nwis.waterdata.usgs.gov/tx/nwis/