Terrain Analysis using Model Builder
Prepared by David R. Maidment and David G. Tarboton
Fall 2004
This tutorial shows how to solve a simple terrain processing and hydrologic analysis problem using the ArcGIS Model Builder to develop an automated workflow sequence. The input data are two small grids that can be typed in a word processor elev.txt and rain.txt. These grids contain a 6-line header file which defines the number of rows and columns, the coordinates of the lower left corner, the cellsize and the value for cells which have no real data in them. Then the data values follow in row-column format. All dimensions of the terrain grid are in meters and the rainfall is in mm.
Elev.txt
ncols 7
nrows 5
xllcorner 0
yllcorner 0
cellsize 100
NODATA_value -9999
57 55 47 48 48 50 53
53 67 56 49 52 54 42
53 52 45 36 37 43 38
51 58 40 42 40 39 38
55 39 38 38 36 38 38
Rain.txt
ncols 7
nrows 5
xllcorner 0
yllcorner 0
cellsize 100
NODATA_value -9999
900 980 1240 1260 1280 1290 1300
950 970 960 980 1050 1100 1180
940 945 950 958 985 1040 1100
860 890 920 940 970 990 1040
830 870 880 900 950 1000 1060
Procedure
The workflow process sequence we want to automate is:
- Convert the ascii file elev.txt to an ArcGIS elevation Grid
- Use the Fill function to fill its pits
- Use the Slope function to determine the cell to cell slopes in the filled grid
- Use the Flow Direction function on the filled grid to determine cell to cell flow direction using the D8 method.
- Use the Flow Accumulation function to add up the number of cells upstream of a given cell
- Convert the rain.txt file to an ArcGIS rain Grid
- Convert this to a runoff grid using the function Runoff = 0.51 * Rain – 336 whose values are in mm per year of rainfall and runoff
- Compute the Weighted Flow Accumulation using the Runoff grid as the Weights and the Flow Direction grid determined earlier.
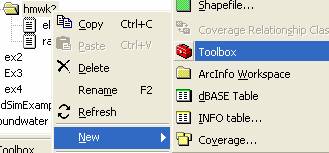
Open ArcCatalog and navigate to the folder where you want
the homework solution to appear. Right
click on the folder and create a New
Toolbox. Rename the toolbox Terrain.
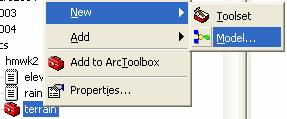
Right click on the toolbox, and create a New Model
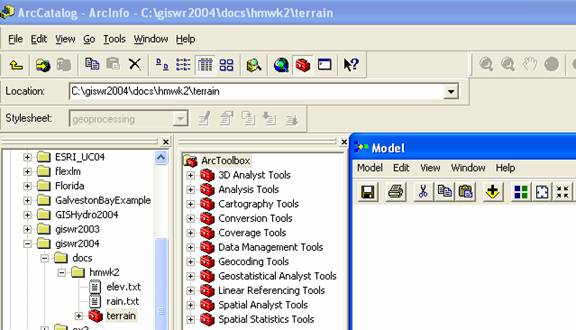
You will see a blank Model palette open up. Click on the Toolbox icon in the Arc Catalog
menu ![]() and open up Arc Toolbox.
and open up Arc Toolbox.
Setting up the
Workflow Sequence
To accomplish terrain processing and rainfall accumulation, we need a sequence of tool operations. This is accomplished by dragging the tools from Arc Toolbox and linking them in the model palette.
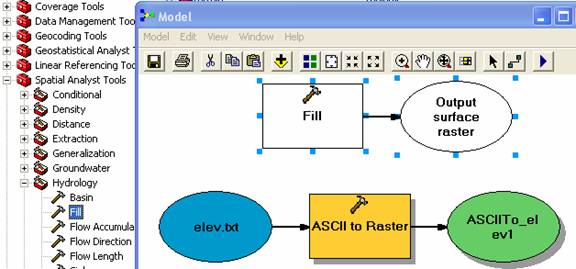
First, lets convert the ascii text file for the terrain into an Arc Grid format. Go to Conversion Tools/To Raster and click on the ASCII to Raster tool. Drag it onto the Model palette.
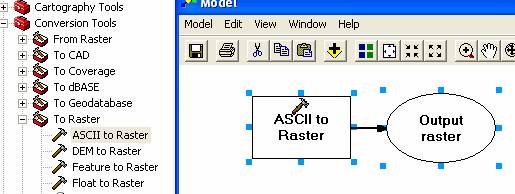
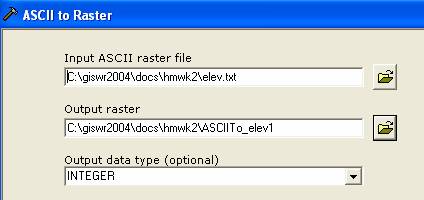
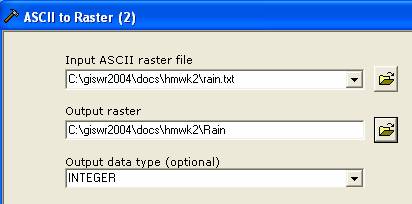
You’ll see the tool appear with blank background. Double click on the ASCII to Raster tool, open the dialog box, and navigate to the location of the elev.txt file as the Input ASCII raster file. Notice that when you do this, an Output raster name is automatically generated.
Click Apply and Ok, and return to the Model palette, where you’ll see that the icons are now colored.
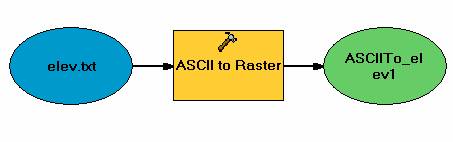
The Blue oval is the input file, the yellow box is the tool and the green oval is the resulting imported grid file.
If you right click on the tool icon and select Run,
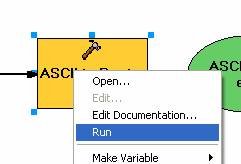
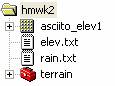
you’ll see a new grid icon for asciito_elev1 appear in your folder.
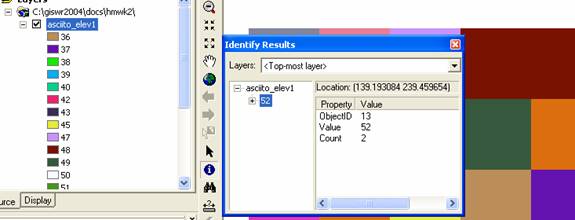
If you open ArcMap and add the theme asciito_elev1 to it,
you’ll see a multicolored grid which you can click on using the ![]() tool to see the elevations in various
cells. You can check to see that the
elevations entered in the text file have been transformed into the Grid display. Don’t worry about the message saying that
these cells lack a spatial reference when ArcMap first displays the theme.
tool to see the elevations in various
cells. You can check to see that the
elevations entered in the text file have been transformed into the Grid display. Don’t worry about the message saying that
these cells lack a spatial reference when ArcMap first displays the theme.
Save the ArcMap document and close ArcMap because the Model will not run in ArcCatalog if its themes are being accessed by ArcMap at the same time.
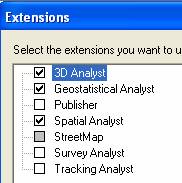
Now lets extend the model using some Spatial Analyst function. First, make sure that the Spatial Analyst extension is turned on in Arc Catalog. Choose Tools/Extensions
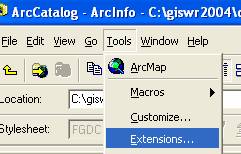
and make sure that the box is checked next to Spatial Analyst
Lets fill the pits in the elevation grid. In the Arc Toolbox window in Arc Catalog, Go to Spatial Analyst Tools/Hydrology/Fill and drag this tool into the Model palette.
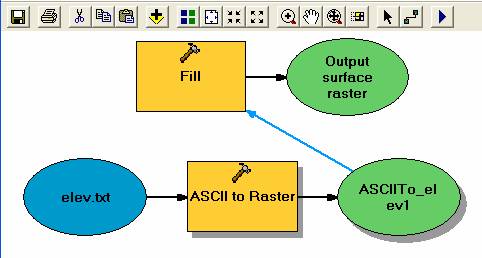
Choose the ![]() tool in the model window and draw a line between the ASCIITo_elev1 grid
and the Fill function. You’ll see that
the Fill function is now lit up yellow as it has an acceptable input.
tool in the model window and draw a line between the ASCIITo_elev1 grid
and the Fill function. You’ll see that
the Fill function is now lit up yellow as it has an acceptable input.
If you hit the ![]() button, you’ll see the Model start off from
the result it has already computed, and run the Fill function.
button, you’ll see the Model start off from
the result it has already computed, and run the Fill function.
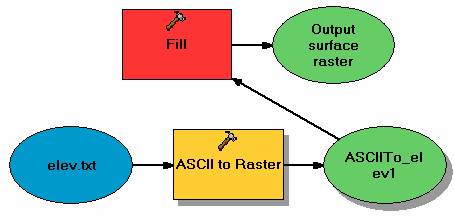
It creates a new raster called fill_asciito1
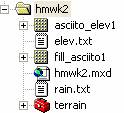
If you open ArcMap again and add the new raster theme
fill_asciito1, you can see which cells have been filled and which remain the
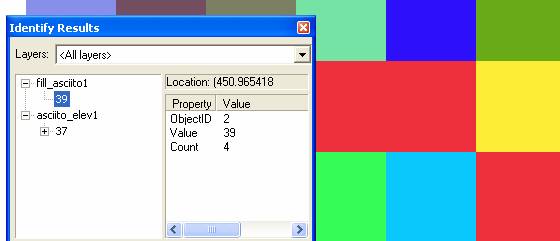
same elevation using the ![]() tool..
In the Identify Results window that appears, change the Layers option to
<All layers> so you can see values from all the grids displayed, rather
than just the topmost one. Close ArcMap
again.
tool..
In the Identify Results window that appears, change the Layers option to
<All layers> so you can see values from all the grids displayed, rather
than just the topmost one. Close ArcMap
again.
Now lets complete the terrain analysis. Get the Spatial
Analyst Tools/Surface/Slope tool and connect it to Output Surface Raster and do the same with Spatial Analyst Tools/Hydrology/Flow
Direction tool and name the output drops grid Drops (make sure that the path to this Grid points to your working
directory). Connect the Output Flow Direction
Raster to the Hydrology/Flow Accumulation
Tool. Use the ![]() button to automatically organize the icons
better.
button to automatically organize the icons
better.
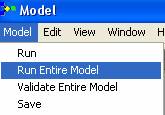
Make sure ArcMap is closed and use Model/Run Entire Model to run all these functions.
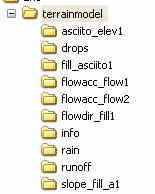
You’ll see the red box moving along through the network of functions and when its done, you’ll see that you’ve got quite a few new grids available.
Drops is a grid that gives the slope of the steepest descent line from a cell in %
Flowdir_fill1 is a flow direction grid computed from the fill elevation grid
Slope_fill_a1 is a slope grid computed from the filled elevation grid
Flowacc_flow1 is a flow accumulation grid computed from the flow direction grid.

Rainfall-Runoff Analysis
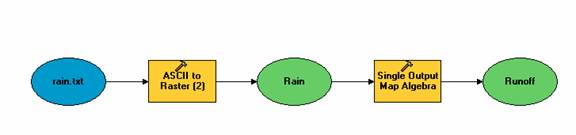
Convert the rain.txt file into a rainfall grid called Rain using the same Conversion Tools/To Raster/ASCII to Raster tool that you used earlier on the elev.txt file. Name the output grid Rain.
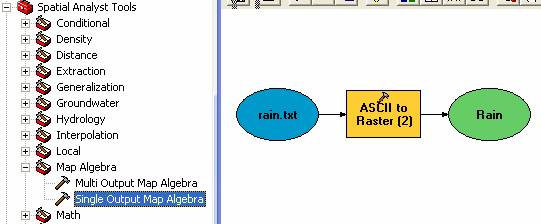
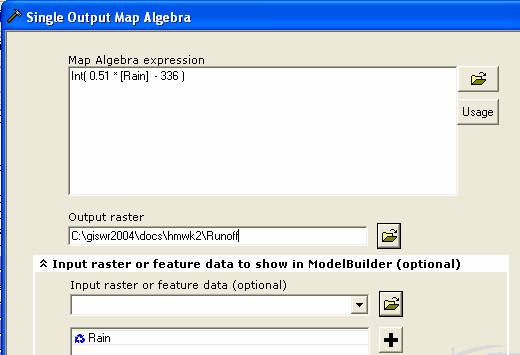
Drag the Spatial Analyst Tools/Map Algebra/Single Output Map Algebra tool onto the Model Palette and connect it to the Rain grid. Click on the Map Algebra tool and fill in the output raster as Runoff, the map algebra expression as Int ( 0.51 * [Rain] – 336 ). The shapes of the parentheses and the spacing between the elements of the expression are important. What you are doing here is converting the rainfall grid into a runoff grid by multiplying each rain cell value by 0.51 and subtracting 336 mm from the result. The result is converted to an integer grid (Int) so it can be used as a weight in a weighted flow accumulation.
The result appears as follows. Click on the ![]() button and the new functions will be run. You can check on their validity by checking
the resulting values in ArcMap.
button and the new functions will be run. You can check on their validity by checking
the resulting values in ArcMap.
Weighted Flow
Accumulation
Now lets complete the exercise by combining the rainfall and terrain models and computing the weighted flow accumulation for the runoff grid.
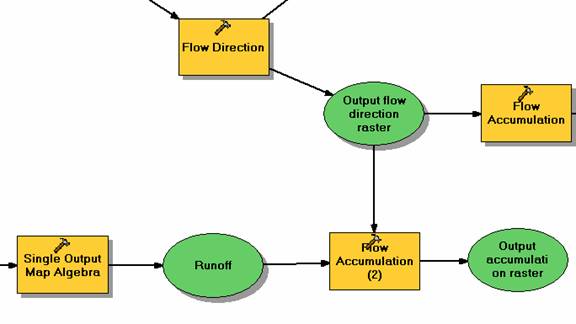
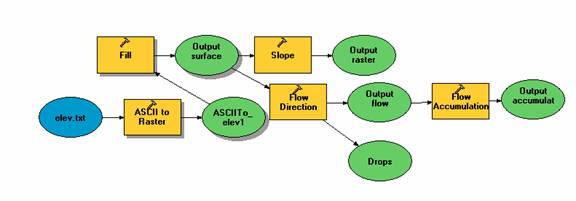
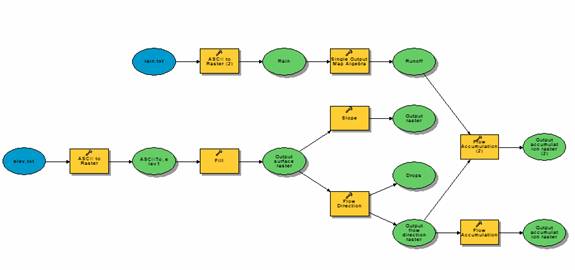
The result of Flow Accumulation (2) is an accumulation of all the upstream runoff values for each cell. Here is now the complete model that we have created after the icons have been reorganized. If you use Model/Run Entire Model in Arc Catalog, you’ll see the legend redraw as each new grid is created. Newly created grids overwrite existing ones of the same name in the working directory.
You can add the new grids to an Arc Map display and check the runoff in each cell and also the accumulated runoff of upstream cells after the model is run.
Running the Completed
Model from ArcMap
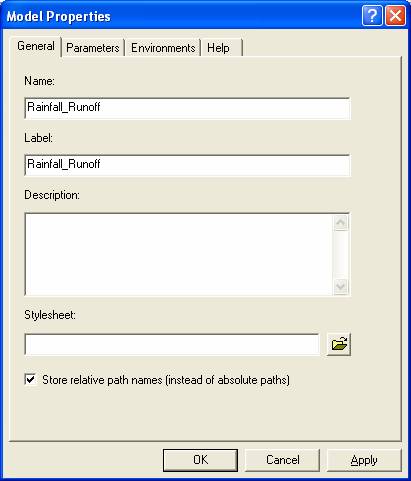
Suppose that we want to take the Terrain toolbox to another folder and run it again. To do this, we’ll first locally path the file references in the model. Use Model/Model Properties to open a dialog box
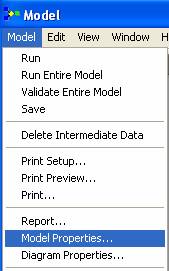
Click on the box that says “Store relative path names (instead of absolute paths)” and rename the model Rainfall_Runoff. Click Apply, and Ok, and then Model/Save and you’ll see that in Arc Catalog, the Terrain toolbox now contains the Rainfall_Runoff model.
![]()
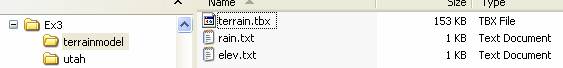
Use Windows Explorer to copy the Terrain toolbox terrain.tbx and the elev.txt and rain.txt to a new folder.
In Arc Map, add Arc Toolbox and right click on the clear area to the right of the tools and select Add Toolbox.
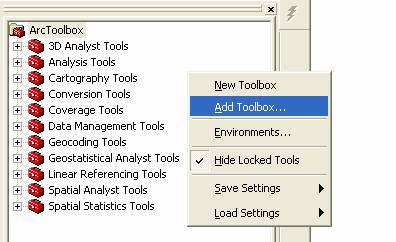
Navigate to the new working folder and select Terrain

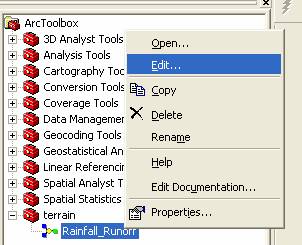
The open the Terrain toolbox using Edit. You’ll see the whole model displayed as it was before.
If you click on the ASCII to raster function for elev.txt, you’ll find that elev.txt is assumed to be in the same folder as the toolbox and that the result files are now pathed out to be put into the new folder.

and if you use Model/Run Entire Model, you’ll find that all the new grids are created in the new working folder.
Thus, you’ve succeeded in creating a workflow model, move it to another location and execute it again. This is a powerful device because it enables you to set up automated workflow sequences and give them to others to execute or document them in your research as Model Builder icon maps.