National Hydrography Dataset and Networks in ArcGIS
Prepared by
Center for Research in Water Resources
September 2003
Contents
·
Computer and Data Requirements
Part 1. The National Hydrography
Dataset
·
Obtaining National
Hydrography Dataset Data
·
Viewing
and Inspecting NHD Feature Classes
·
Building a Geometric Network
in ArcCatalog
·
Using the Utility
Network Analyst Toolbar in ArcMap
Part 3. Applying the Arc Hydro
Framework Data Model
·
Applying the Schema framework
Goals of the Exercise
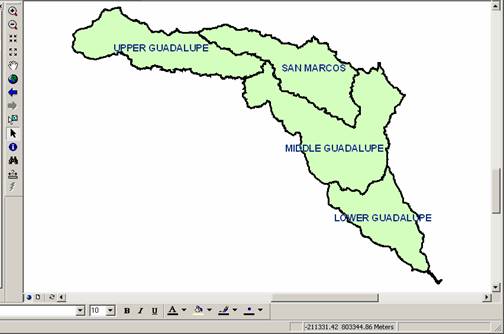
The
study area selected for this exercise corresponds to the San Marcos River basin
(8-digit HUC #12100203), which is part of the Guadalupe River Basin already
used for exercise 2.
This
exercise has three parts:
Part
1 introduces you to map hydrography data depicting water features of the landscape,
and specifically hydrography data from the National
Hydrography Dataset. There is a voluntary addendum to this part in which
you can learn to symbolize and differentiate between the feature
and reach data layers. The attributes accompanying the hydrography data are also described.
Part
2 uses the network
capabilities in ArcGIS to allow you to:
·
Build
a Geometric Network of river and coastline features
·
Assign
Sinks and Set Flow Direction on the Network
·
Perform
Traces traversing the Network upstream and downstream
Part
3 contains the application
of the Arc Hydro schema to create an Arc Hydro Framework dataset and the execution
of a set of Arc Hydro tools to fill in some of the attributes contained in the dataset.
Computer and Data Requirements
To carry out this exercise, you need to use the ArcInfo version of ArcGIS. The first part of this exercise can be carried out using ArcView, but the construction of a geometric network in the second part of this exercise cannot be done with ArcView. In order to download the National Hydrography Dataset data, you need Internet access. The data files used in the exercise consist of ArcInfo coverages from NHD and prepared shapefiles. All of the NHD data being used is in the Geographic projection, NAD 83 datum. The following files are required for this exercise and are stored in the file http://www.ce.utexas.edu/prof/maidment/giswr2003/ex5/Ex5Data.zip
For
UT Austin students, the files are located on the LRC NT network in the
directory class\maidment\giswr\SanMarcos\.
·
12100203
zip file: the NHD
data for
·
HydroEdge,
HydroJunction, MonitoringPoint,
Waterbody, Watershed: shapefiles for the
·
ArcHydroFrameworkSchema.mdb:
The schema to be applied
to your data model.
Part 1: The National
Hydrography Dataset
Obtaining National Hydrography Dataset Data
The
National Hydrography Dataset (NHD) is a substantial set of digital data and
contains information about the surface water drainage network of the
The
NHD is available at the website http://nhd.usgs.gov.
At this web site, click on the Data tab on the left side of the screen
and then click on the first bullet, Obtaining NHD Data. The NHD is
organized by Hydrologic Cataloging Unit (HUC). You will see a map of the
Zoom
in several times on
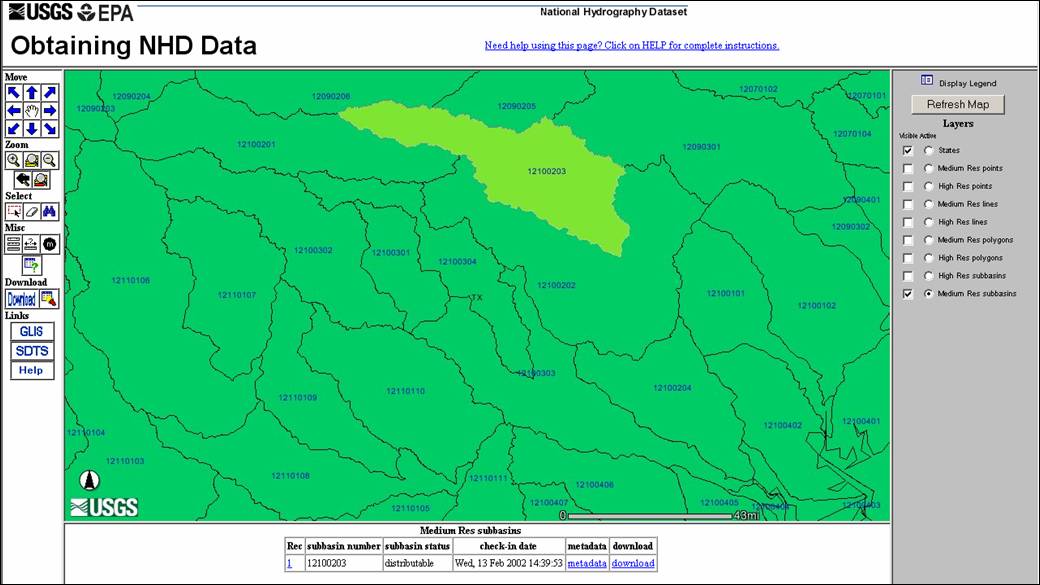
Press
the Download button on the lower right of the window. Fill out the NHD
Download screen information and Continue. Click Yes to
the Security Warning and click Download on the
Download page. Navigate to the location you want to place the
12100203 file, and click OK to the Successful Download
window. You should now have all the 12100203.tgz files, a
compressed set of folders with the NHD data.
It
can occur that you get the response:

If
so, you can go to the Trouble Downloading? link, and choose Alternative
Download Methods and go to Medium
Resolution Data. Scroll down the
list to the 12100203.tgz link; click on it, then choose Save this file to a disk. Navigate to
the directory you want to place the data in.
Now
you have the NHD data for the HUC that makes up the
Structure of the
National Hydrography Dataset
To
explore the structure of the NHD dataset unzip the 12100203.tgz file using the
Windows utility Winzip. Extract the file to the
12100203 folder. Click Yes to the Winzip window asking if Winzip
should decompress 12100203.arc.tar to a temporary folder. In Windows
Explorer, navigate to the 12100203 folder. Please note that using Winzip for uncompressing the NHD files has some limitations
not important to this exercise. These limitations are important if
you want to append or join NHD files for several adjacent HUC units. In
that event, use the uncompression software provided
on the NHD website.
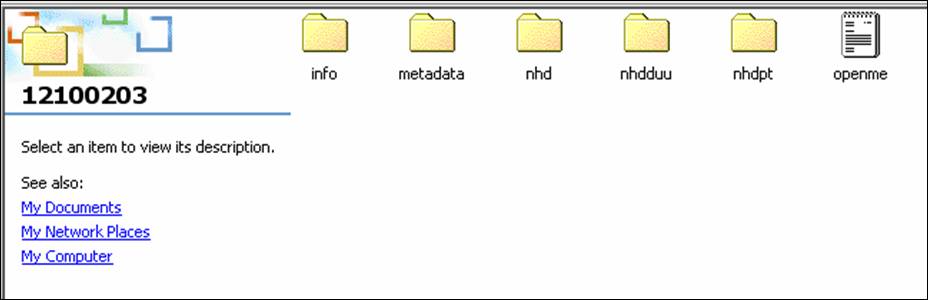
The
NHD is organized as three ARC/INFO coverages (nhd, nhduu, and nhdpt), many related INFO tables, and text files containing
metadata. The nhd coverage
contains the line and polygon features. This coverage has line, polygon
and node topology, which together form a type of network topology. The nhdpt coverage contains point features related to
the hydrography. The third coverage, nhdduu, contains metadata and information about
sources and updates of the hydrographical information. The spatial
elements of the surface water network are found in the nhd
and nhdpt coverages.
An
addendum to this exercise NHDSanMarcos.doc
explores the National Hydrography Dataset for the
Part 2: Networks in ArcGIS
Building a Geometric Network in ArcCatalog
We
can build a geometric network from the route.drain coverages in the NHD files.
Within the network functionality of ArcGIS,
the ability to trace along networks based on flow directions and relationships
is central. Open ArcCatalog and navigate to
your data folder containing the files for exercise 5. Right-click
on the Ex5 folder in the Table of Contents on the left. Drag down
to New, and then drag over to Personal Geodatabase.
Name
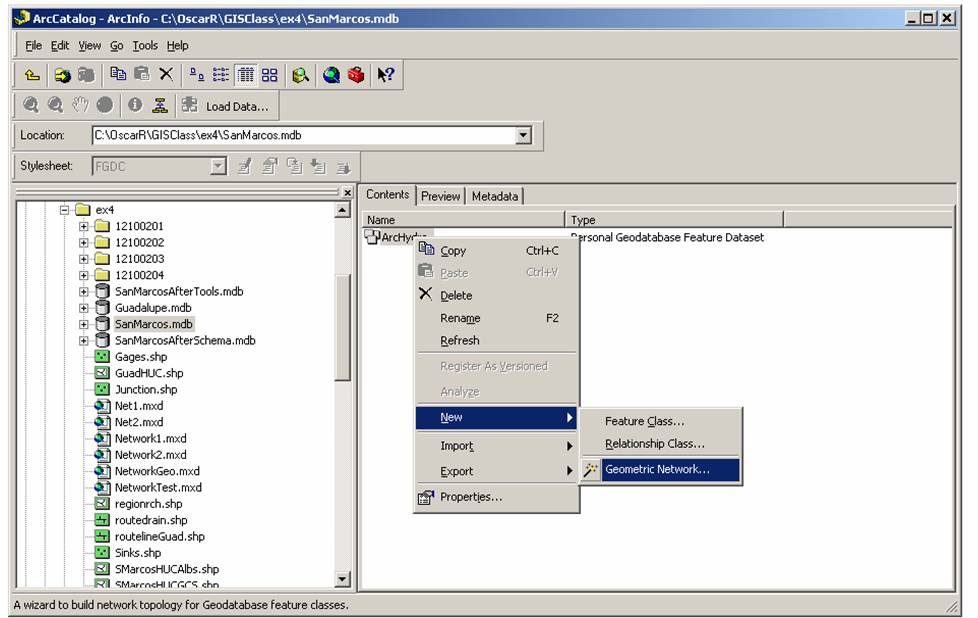
the geodatabase SanMarcos. Right-click
on SanMarcos.mdb and drag down to New and then to Feature
Dataset....
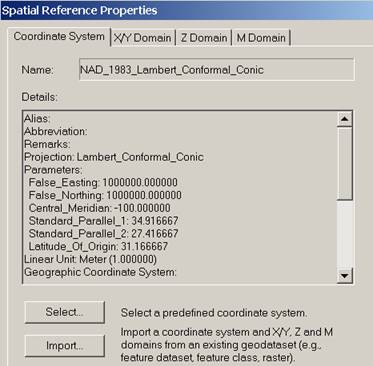
Enter
the Name: for the Feature Dataset as ArcHydro
(make sure that ArcHydro is one word and not two
words). Click Edit.. for
the Spatial Reference Properties and click on Import... a
coordinate system and X,Y,Z, M domains Navigate to the data folder and
select Watershed.shp. This sets the
spatial extent for the feature dataset the same as the extent for the Watershed.shp data layer, which contains a layer with
raster-derived catchments for the
At
this point, you want to enter all the data layers directly into the feature
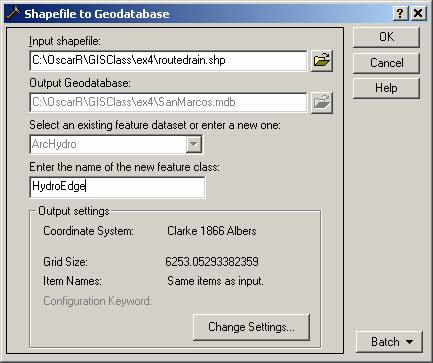
dataset ArcHydro. Right-click
on the feature dataset ArcHydro and drag down
to Import and to Shapefile to
Geodatabase. For the Input shapefile:
browse to the HydroEdge.shp data layer (an
enhanced version of the NHD route.drain layer for the
San Marcos River basin) and keep the name of the new feature class as HydroEdge to be consistent with the ArcHydro geodatabase structure. Click OK.
The software then converts the shapefile into data
within the feature dataset.
Add
the remaining shapefiles HydroJunction.shp,
Waterbody.shp, and MonitoringPoint.shp
shapefiles from the Ex5Data.zip file to the ArcHydro feature dataset by importing from Shapefile to Geodatabase in ArcCatalog and keeping the standard names of all new
feature classes. These five feature
classes are the ones contained in the Arc Hydro Framework dataset, which
is the simplest form of the Arc Hydro data model. The files have been prepared for you in this
exercise to simplify its execution but in reality it takes quite a significant
amount of data preparation to get the files you are using.
·
HydroEdge.shp contains the river network for
·
HydroJunction.shp contains Junctions on the NHD network representing Stream
gages, Outlets for waterbodies, and Outlets for
watersheds. IN addition, you can introduce new Junctions based on other points
of interest (Control Points, Water Rights, Ecological monitoring points, Water
withdrawals, etc.).
·
MonitoringPoint.shp contains the USGS stream gages for the
·
Waterbody.shp contains the waterbody regions as
contained in the NHD layer region.rch.
·
Watershed.shp contains watersheds delineated for each USGS streamgage from a raster analysis using a DEM (you learned
how to do this in Exercise 4 in this course).
Ok,
now for the cool part, we are going to create a geometric network!!!
From
the Network feature dataset, right-click and drag down to New and to Geometric
Network...
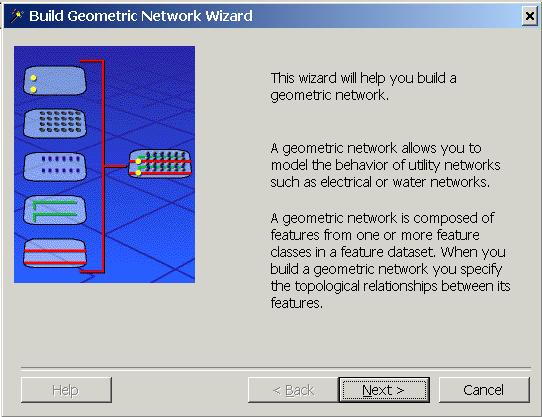
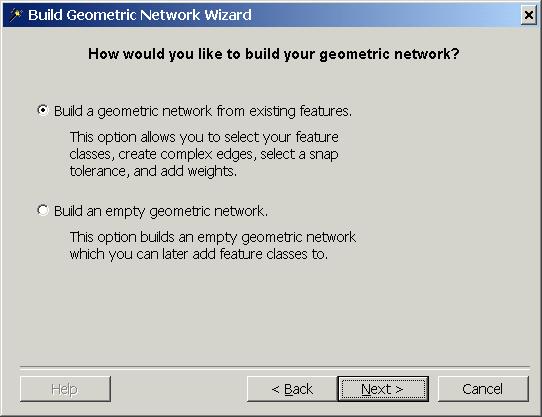
This
launches a “Build Geometric Network Wizard” to help you create a network
from existing feature classes in a feature dataset. Click Next.
Because
you now have the HydroEdge data layer as the
arcs, which you want to use as your network and HydroJunction
to determine flow direction, you want to Build
a geometric network from existing features. Make sure this radial
button is highlighted and click Next.
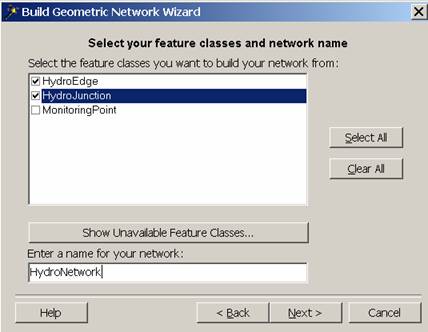
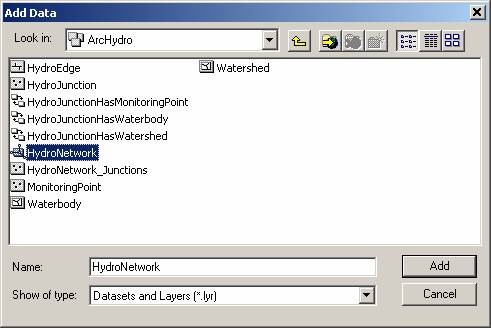
The
next screen determines which existing features should be incorporated in the
network. Because you have entered some feature classes into the feature
dataset, they are listed as defaults. Check only HydroEdge
and HydroJunction and enter the name HydroNetwork. (don’t
forget to name this network as HydroNetwork as the
default name of ArcHydro_Net does not allow you to
apply the Arc Hydro Schema later in this exercise). Click Next.
Click OK to the ArcCatalog Warning about
the "Enabled" field.
For
Do you want to preserve existing enabled values? Say yes. Enabled edges and junctions permit flow
through them.

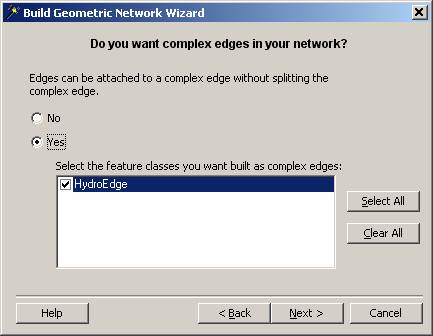
For
Do you want complex edges in your network?, Select the radial button for Yes
to allow complex edges in HydroEdge. Click Next.
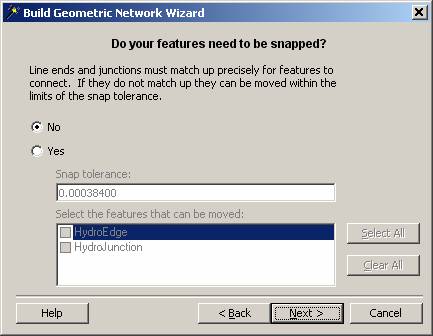
The
Junctions in HydroJunction accompanying the network
fall exactly on the network and do not need to be snapped. Highlight the
radial button No for Do your features need to be snapped? And
click Next.
The
Junctions in HydroJunction can be used to
contain the sinks for the
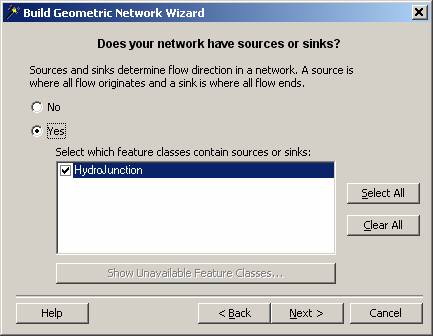
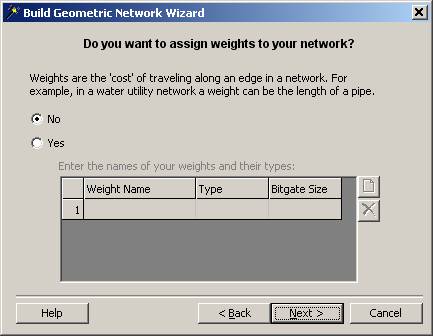
The
network you are working with has no weights assigned to it, so make sure the
radial button has No highlighted and click Next.
A
summary is then displayed of the input information. Check over this
information to ensure it is correct, and click Finish. The elements
of the feature classes are then converted to have network topology. If
you get an error message saying that some features cannot be built into a
network, don’t worry about this, just continue on. Voila!! Congratulations. You have
just created a geometric network! What this means is that lines are
transformed to network edges, edges meet at points called junctions,
and the connectivity of lines and junctions is defined by an internal data
structure called a logical model (as distinct from the geometric
model of the lines and edges which defines where they are located in
geographic space). Sinks are special kinds of junctions where flow
terminates or drains out of the network.
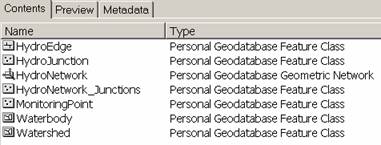
In
ArcCatalog, look in the feature dataset ArcHydro. A new icon and new feature classes
are added, the HydroNetwork network and its
accompanying HydroNetwork_Junctions, which are
automatically created when the feature classes are converted to have
topology. Close ArcCatalog. Now you want
to look at the network within ArcMap to use the network functionality.
Lets
Preview the Network that you've just created. Click on the Network Icon
and select Preview in the adjacent right window tabs. Click individually on the
four feature classes HydroEdge, HydroJunction,
HydroNetwork, and HydroNetwork_Junctions
to see the individual elements that make up the network. Pretty
cool! Now we're going to assign flow direction on the network edges
and do some trace tasks on the network.
Using the Utility Network Analyst Toolbar in ArcMap
Open
the ArcMap and make a new project. Add
the Arc Hydro geodatabase that you’ve just
created. Recolor the themes to make them
more natural. There is a Symbol for
“River” that is well suited for representing the HydroEdge
feature class. Turn off the HydroNetwork_Junctions because otherwise they clutter up
the display.
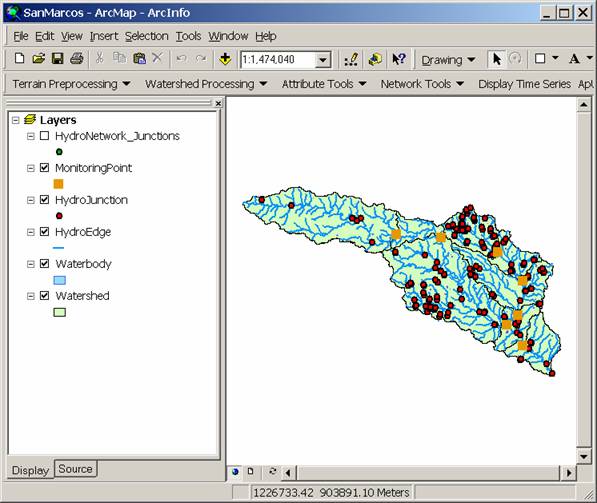
To
be turned in: A map showing the Arc
Hydro framework dataset for the
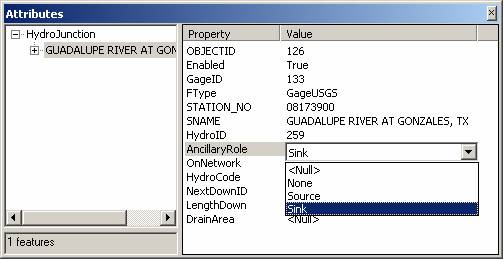
To
generate the flow direction along the network, the junctions representing sinks
must have an Ancillary Role value of 2, indicating a sink.
In this case the junction representing the Outlet of the
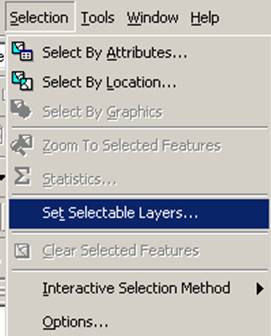
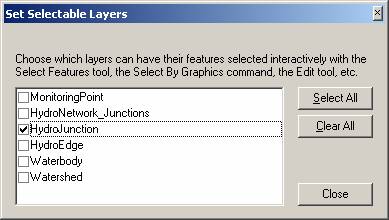
Go
to Selection, Set Selectable Layers… and check the box only for HydroJunction as shown below.
Zoom
in to the Outlet of the basin (lower right corner) and select the Junction.
Click on the attributes icon ![]() and set the Ancillary Role equal to Sink.
and set the Ancillary Role equal to Sink.
Close
the attributes window and click again on Editor. Drag to Save
Edits.
Arc
Hydro Tools
We
are now going to use the Arc Hydro tools again. These should already be installed on your
machine since we used them for Exercise 4.
Add the Arc Hydro toolbar by going to the View menu, Toolbars,
and make sure there is a check next to Arc Hydro Tools. If you don’t see any entry on the toolbar for
Arc Hydro Tools, it means that the tools are not installed on your
computer. If that is the case, the tools
are contained in the zip file that you downloaded to start this exercise, in
the folder arcHydroSetup.
If
an older instance of the Arc Hydro tools are installed
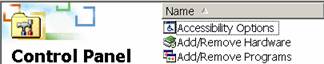
on your machine, you have to first uninstall them by using the Windows/Settings/Control
Panel option for Add/Remove Programs. Use this tool to Remove
the currently installed Arc Hydro Tools.
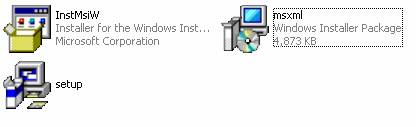
Then,
in the arcHydroSetup folder, run the setup
application, and you should have a correctly installed set of Arc Hydro tools
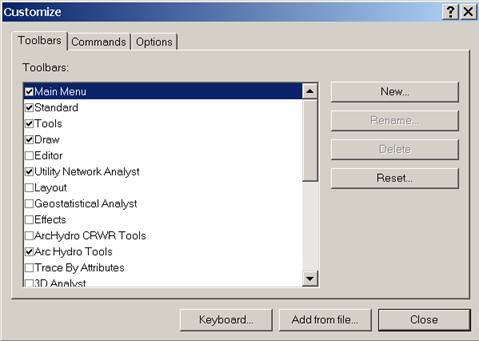
ready to use with ArcMap. If you go to View/Toolbars and don’t see Arc
Hydro tools, go to Tools/Customize and click on the Arc Hydro tools icon.
Setting
the Flow Direction
Normally,
when you build a geometric network, you set the flow direction by using the ArcGIS Network Utility Analyst to direct the flow on all
the network edges towards the HydroJunction sink you just
created. In this dataset, however, there
are some loops and other network features to which flow direction cannot be
assigned automatically in this way. The NHD has a flow table that tells for
each reach what is the next downstream reach, and by
using this table and doing some hand editing, the correct flow direction has
already been assigned to each of the HydroEdges in
the attribute value FlowDir.
The Flow Direction in a
network is stored as an esriFlowDirection value for
each Edge and may have the following values:
·
esriFDUninitialized 0 Uninitialized
·
esriFDWithFlow 1 In the direction of digitization of the edge
·
esriFDAgainstFlow 2 Opposite to the direction of
digitization of the edge
·
esriFDIndeterminate 3 Indeterminate flow direction
This is an example of a method
of assigning values to an ArcGIS attribute called a Coded
Value Domain in which each of the admissible attribute values has a number
and also a text description.
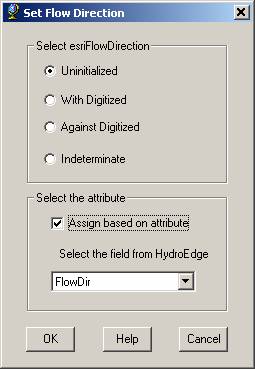
For this exercise, these
predefined values have already been stored in the HydroEdge
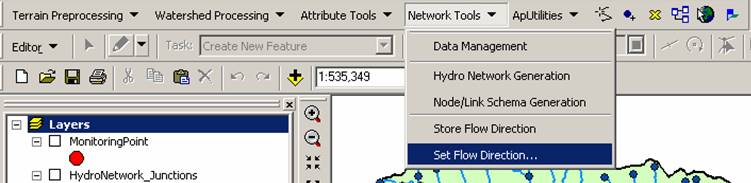
attribute table under the field FlowDir. In
the ArcHydro Tools Toolbar select Network Tools
and Set Flow Direction… Be
careful not to use the tool Store Flow Direction, or you’ll overwrite the
correct flow direction values with uninitialized
values.
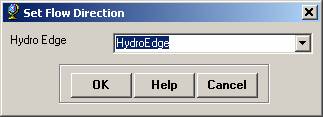
Set the Flow Direction for the HydroEdge feature class and Assign the Flow based on the existing attribute field called FlowDir. If you have a disaster at this point because you set the flow direction incorrectly, go back to Arc Catalog, delete your geometric network, delete the HydroEdge feature class, reimport the HydroEdge shape file, and start the process again by rebuilding your geometric network.
ArcGIS Network Tools
ArcGIS has a set of powerful tools called the
Utility Network Analyst. From the ArcGIS View menu, go to Toolbars and check
the Utility Network Analyst toolbar.
![]()
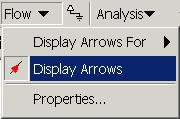
Click
on the Flow dropdown menu and go to Display Arrows. The
arrows may not all appear and only some black circles may appear. The
software is still not foolproof when displaying the arrows. If you have a
problem, try turning on and off display arrows, and that may
work.
The
picture below shows how the arrows should appear. Turn on your HydroNetwork_Junctions
feature class. Notice how there is a
generic junction of this kind at the end of every edge.
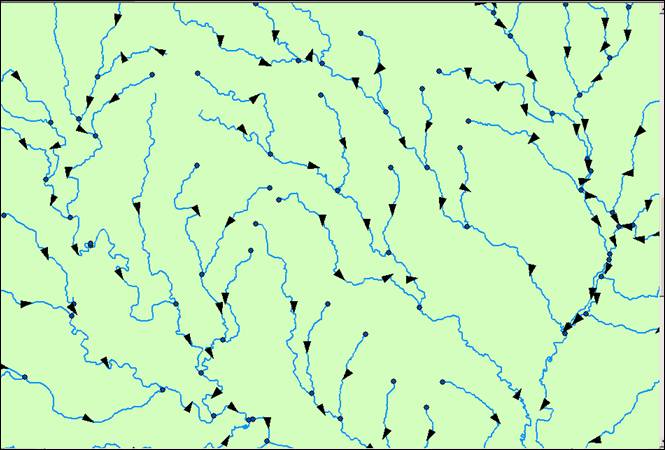
Each
reach in the network may have an arrow or a circular "blob" on it to
indicate the flow direction along that reach. A circular "blob"
indicates that the flow direction is indeterminate along that reach. This
is caused by looping in the network, in which the flow path of water cannot be
chosen. Zoom into an area to see the arrows and how the flow progresses
down the network. The area studied in this exercise does not have many
indeterminate flow paths because it is not along the coast. Coastal areas
generally have more looping in the network, leading to undetermined flow
directions.
Because
it takes longer for the screen to redraw with the arrows, turn them off by
going back to the Flow dropdown menu and click again on Display
Arrows.
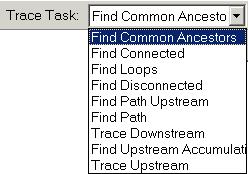
Network
Tracing
Now
that the flow direction has been determined, it is possible to perform traces
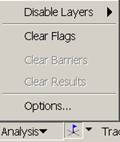
on the network to determine topology relationships between reaches. The Trace
Task menu lists the options that are available:
|
|
|
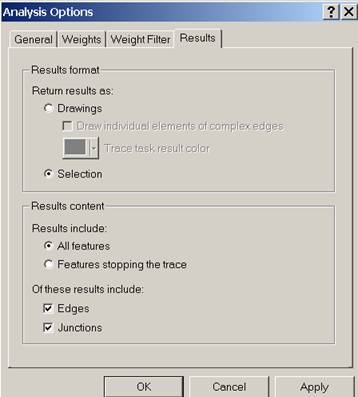
We
first want to set some Analysis/Options in the Utility Network Analyst
toolbar.
On
the Results tab, change the Results format from Drawing to
Selection. Now the trace results will be shown immediately as a
selection, which can then be exported to a feature class if desired.
Click OK.
Tracing
tasks are defined by first placing flags and barriers
along the network to indicate where the trace should start and stop
respectively. The icon after the Analysis menu places the flags and
barriers. There are four options:
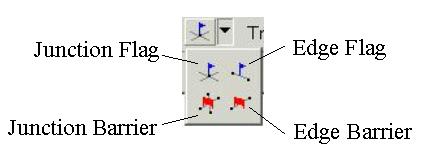
Junction
flags and barriers are placed at junctions, while edge flags and barriers are
placed along edges. When using an edge flag or barrier, the trace either
begins or ends and includes that entire edge, as opposed to only a portion of
the edge.
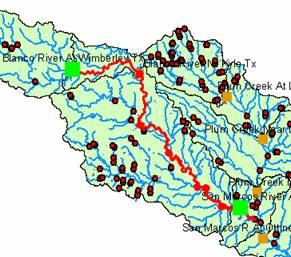
Lets suppose we want to trace upstream and downstream of the
USGS Gage on Plum Creek near
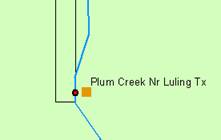
Put
a Junction flag on top of the HydroJunction
Before
you do the trace, make sure that you make all the layers selectable by using
the ArcMap Selection/Set Selectable Layers/Select
All.
To
perform the trace function, you must set the Trace Task from the drop
down menu as Trace Upstream and then click the Solve icon ![]() . The solution appears as a
selection. From the Selection menu, drag down to Zoom to
Selected Features to see the selected reaches upstream from the Plum Creek
Gage.
. The solution appears as a
selection. From the Selection menu, drag down to Zoom to
Selected Features to see the selected reaches upstream from the Plum Creek
Gage.
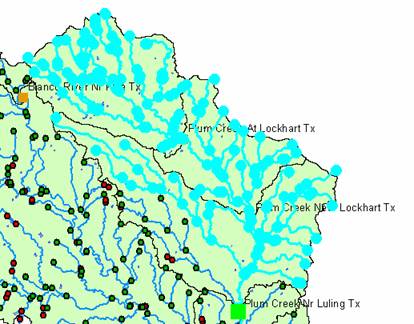
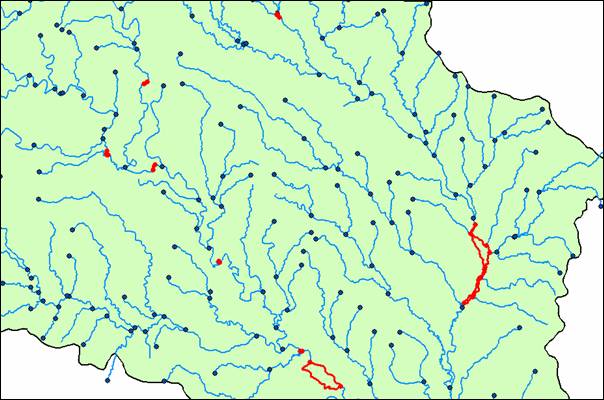
To be turned in: A map of the features selected by the Trace Upstream
task. How many features are selected by this trace? (Look at the selected features in the
attribute tables)
You
can see that all connected reaches were selected as the solution to the trace
upstream from the position of the flag. We can search for loops in the
area by using the Find Loops trace tasks by doing the following
procedure: First, clear the existing Flags:
Locate
the Junction in HydroJunction representing the sink
at the outlet of the
Notice
how the flow direction is still correctly set on the loops.
Another
important Trace Task is the Find Path trace. This trace will normally
yield unambiguous results. Suppose we want to find the path between the
stream gages on the
Notice
how all of the edge on which the downstream gage is located is selected even
though the junction lies on its interior.
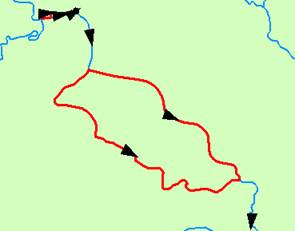
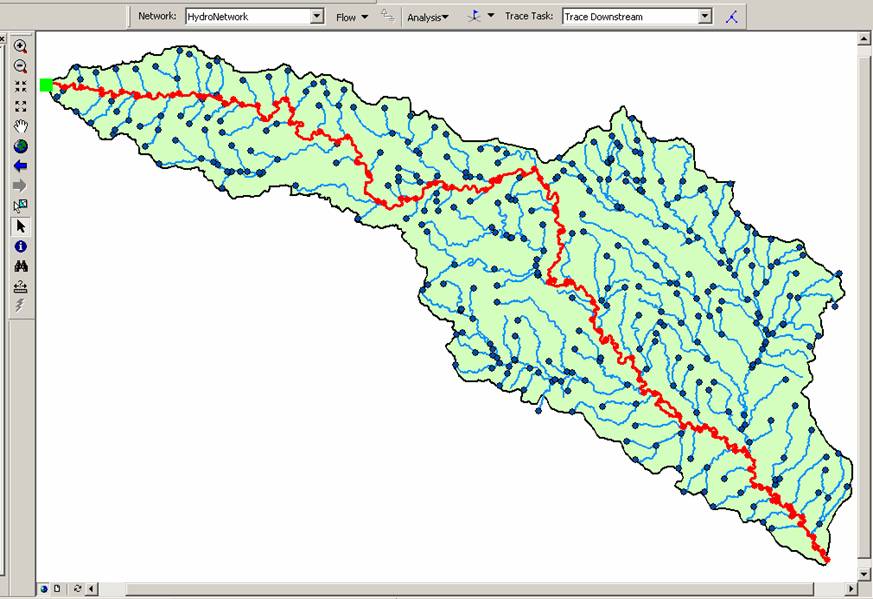
The
final trace task you will perform will be a Trace Downstream from the
apparent headwater junction in HydroNetwork_Junction.
Clear the flags and the selected features. Place a new flag only at the
headwater junction (most upstream junction on the network). You will also
utilize the other method of returning results in a tracing task. Change
the Trace Task to Trace Downstream and click the Solve
icon. Again, the results are different to the Trace Upstream results
because only the connecting downstream path for the upstream junction is
selected.
To be turned in: A map of the features selected by the Trace
Downstream task. How many features are selected by this trace?
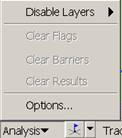
To
clear the results as a drawing, go to the Analysis menu and go to Clear
Results. Save your ArcMap document. Be creative and try other
traces from other junctions. Experiment using barriers
on both edges and junctions. When you are finished, close the Edit
Session by going to the Editor menu and Stop
Editing. Say Yes to saving the edits,
and save and close the ArcMap document.
You
have now finished this part of the exercise. Congratulations!
Part 3: Creating
an Arc Hydro Framework Dataset
In
this part of the exercise we will apply the Arc Hydro Schema and some of the
Arc Hydro tools. This portion of the exercise assumes that you’ve
already prepared the data for schema application and you have available a set
of prepared files in an Arc Hydro geodatabase (which you have done by preparing
the
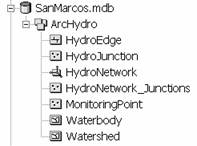
The
required files for this part are:
SanMarcos.mdb
-- the
geodatabase you have just prepared (shown below).
ArcHydroFrameworkSchema.mdb – the
schema that will be applied to this geodatabase.
This
portion of the exercise also requires that you have available and have installed
the Arc Hydro Tools.
Ok,
lets get started!!!
What
you are beginning with is a draft of the SanMarcos.mdb geodatabase that
looks like this:
Applying
the Schema
Add the schema creation wizard to ArcCatalog
The Arc Hydro Schema is a blank geodatabase
that contains assigned attribute names for the Arc Hydro feature classes and
creates relationships between them. By
applying this Schema to your existing ![]() If the schema creation
wizard has already been added to ArcCatalog, skip to
next step, Connect to the Repository.
If the schema creation
wizard has already been added to ArcCatalog, skip to
next step, Connect to the Repository.
(1) Right click in the gray area in ArcCatalog where the buttons are and select Customize. You can also click Customize under the Tools menu.
(2) Click the Commands tab.
(3) If “Case Tools” appears in the categories list, skip to
step (4) of this section. If “Case
Tools” is not in the categories list, click “Add from file” and browse
to the Bin directory where ArcGIS was installed (/arcexe83/bin). Select SchemaWiz.dll and click Open,
then click OK. If you don’t see
the SchemaWiz.dll in /arcexe/bin, it may still
be there but invisible. Use Tools/Find
File in Windows Explorer to locate the file, and then register the .dll using RegCat.exe, which is also located in
/arcexe83/bin (This may also be invisible).
Use Tools/Find File to locate RegCat.exe, right click on it and create a
shortcut on your desktop. Drag the SchemaWiz.dll
file onto the RegCat.exe shortcut and you’ll be prompted with a dialog
to define where to register the .dll. Select ArcMap, ArcCatalog and ArcTools. Now, when you go to the Categories list you
will see that the Case Tools option is now available and the Schema Wizard icon
![]() is visible.
is visible.
(4) Click “Case Tools” in the categories list.

(1) Drag the Schema Wizard command onto a toolbar (adjacent to any existing icon).
(2) Click Close.
(3) Close ArcMap so that only ArcCatalog is open.
Connect to the Repository
(1) In the ArcCatalog tree, click the SanMarcos geodatabase to which you will apply the schema, so that it opens and you can see the Arc Hydro feature dataset it contains.
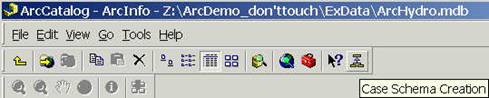
(2) Click
the Case Schema Creation button ![]() to launch the Schema
Creation Wizard. You may get a message
saying that this action requires an ArcGIS or ArcEditor version of ArcGIS. In that event, go to Programs/ArcGIS/Desktop Administrator and set the seat to ArcGIS or ArcEditor.
to launch the Schema
Creation Wizard. You may get a message
saying that this action requires an ArcGIS or ArcEditor version of ArcGIS. In that event, go to Programs/ArcGIS/Desktop Administrator and set the seat to ArcGIS or ArcEditor.
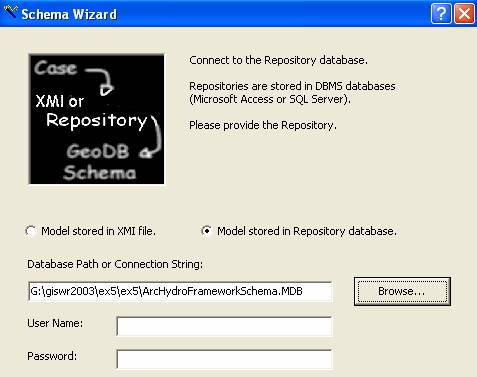
(3) Click Next to skip the introduction step, Click the radial button for Model stored in Repository Database and then click Browse to select the repository database (in this exercise, ArcHydroFrameworkSchema.mdb). Ignore User Name and Password Requirements. Click Next to continue.
(4) Click the name of the object model in the repository for which you want to generate schema (ArcHydroFramework Data Model:: ArcHydroFramework).
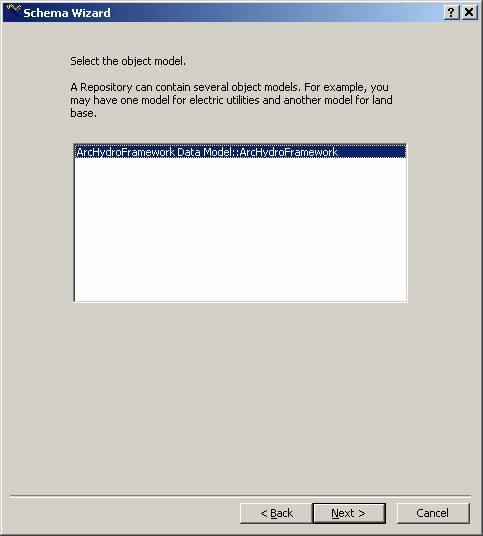
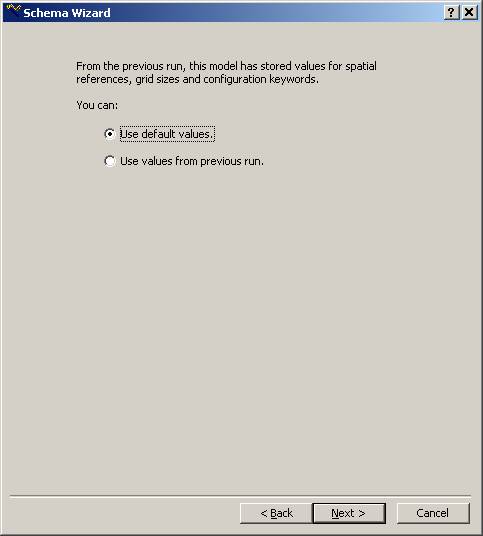
(5) Click Next. This process may take a few minutes. A screen might appear asking you if you would like to use default values or values from a previous run. Select to use the default values. Press Next.
A tree-view of the schema represented in the model is displayed. Using this tree-view, you will now select the object classes (tables), feature datasets, and feature classes from your UML model for which you want to generate schema. Feature classes with red shadow have been automatically detected by the schema creation wizard since they have the correct Arc Hydro standard names. If some class has not been recognized you should click on it and press the Properties button on the lower right corner. Check the Feature class already exists in database box and click OK.
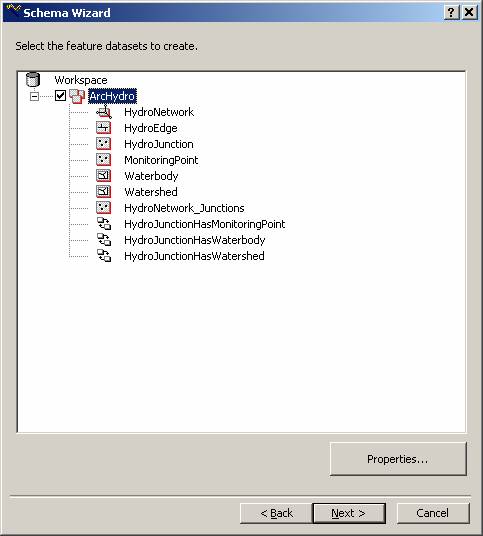
If you generate a schema for datasets that do not already exist in SanMarcos.mdb, new datasets will be created but they will not have any data loaded into them. You can come back at a later time when you do have such data and reapply the schema to include the new data in your Arc Hydro model. You can specify the spatial reference for a new feature dataset by selecting the dataset and clicking Properties. If you generate schema for feature classes that do not already exist, empty classes (tables with no rows) will be created.
Select Feature Datasets
(1) Click on the Arc Hydro
feature dataset and then click the Properties button.
(2) On the Feature Dataset
Properties window click Show Details to show the spatial reference
information. Note that
the spatial reference for that feature dataset has already been set (and that
it coincides with the reference for the existing feature dataset).
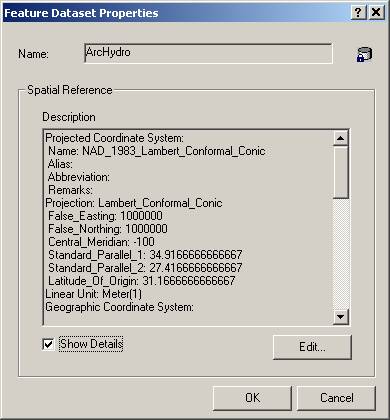
(3) Click
OK to close the properties window.
Set properties of feature classes
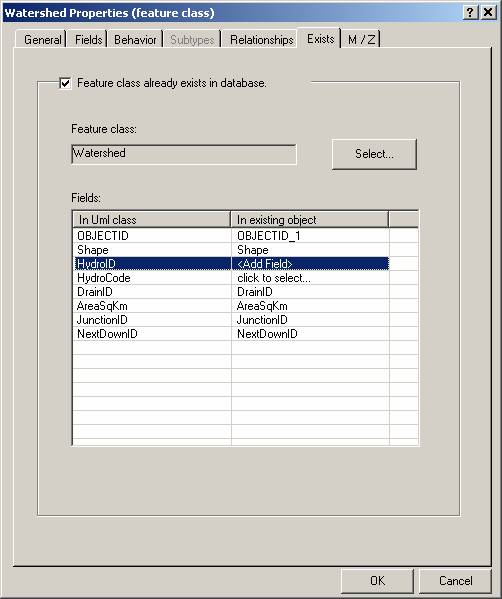
(6) Double
Double-Click on “Watershed” and a dialog box for Watershed Properties will
appear.
(7) Click
on the Exists tab. Note near the
top of the window that there is a check mark by “Feature class already
exists in database” and the Watershed is listed in the Feature Class
box. In this window you will match
fields that were defined in the UML model to those that already exist in the
Watershed feature class.
(8) In
the “In existing object” column, click on each row with “click to select…”
in it. It indicates that the Field does not currently exist in the feature
class. Select <Add Field> from the drop down menu to add the
field. You need to Right Click to
select <Add Field> and
this seems to work best when you right click to the right of the “click
to select…” message in the table.
(9) Repeat
step (6) for all unmatched UML classes (all cells with “click to select…”).
Note: For this exercise just select <Add Field> for all UML class In
Watershed Properties dialog box.
(10)
Your Dialog box should look like
this after you have matched all fields (after changing click to select…
for <Add Field> on right column). Make a list of all the fields in
the UML class column even if they were already included in the feature class.
(11)
Click OK and you will go back to
Schema Wizard.
(12)
Repeat steps 4, 5, 6, 7 & 8 for
all main feature classes in ArcHydro (Watershed, HydroEdge, HydroJunction, Waterbody, and MonitoringPoint). You
should have <Add Field> for any unmatched fields in all existing classes. If you can’t add a field and just have
<None> available to you as a choice, go back to ArcCatalog
and search in the attributes of your original Arc Hydro dataset for an
attribute of that name and delete it.
(13) Click OK and you should be back to Schema Wizard.
Create the schema
Once you have connected to the repository and selected the classes from your UML model for which you want to generate schema, the last part of the Schema Wizard is to actually create the schema in the geodatabase.
Click Next.
At this point, you could review the options you specified in the Schema Wizard. If you wanted to change anything, you would click Back and change the appropriate parameters.
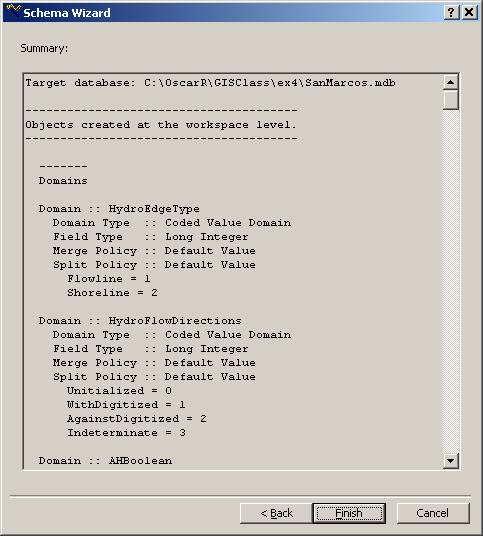
Click Finish to generate the schema in the geodatabase. The generation may take a while. Say No to if you do not want to see the logfile (or Yes if you want to see the logfile!).
Congratulations! You have generated a schema!
If you View the feature classes that
you’ve just worked on in ArcMap, open the attribute tables, you’ll see that
what you have done is to create a series of additional attributes at the right
hand end of your attribute tables --- these are the standard Arc Hydro
attributes.
To be turned in: Make a table that lists the main five feature classes: HydroEdge, HydroJunction, MonitoringPoint, Waterbody and Watershed and list the attributes that were added to these feature classes by the process of applying the ArcHydro schema. List all the fields in the UML class column even if they were already included in the class.
The gage on the
Applying the Arc Hydro Tools
The Arc Hydro tools can compute
values for Arc Hydro attributes in a HydroNetwork.
Add the HydroNetwork data layer to ArcMap.
If you open the attribute Tables of all
main five feature classes (Watershed, HydroEdge, HydroJunction, Waterbody, and MonitoringPoint), you will find that the last few columns
(The ones added by the schema) of the tables are blank with <null>
values in it. The Arc Hydro Tools will be used to populate some of those empty
attribute fields.
Applying The
Network Tools
The flow directions of your network must be set before you can apply the Network Tools. Go to Flow > Display Arrows to see if you have the flow directions set (you should see the arrows on all edges. If you only get black circles you need to set the flow direction as you did before. Go to Network Tools > Set Flow Direction… for HydroEdge based on the Field FlowDir.
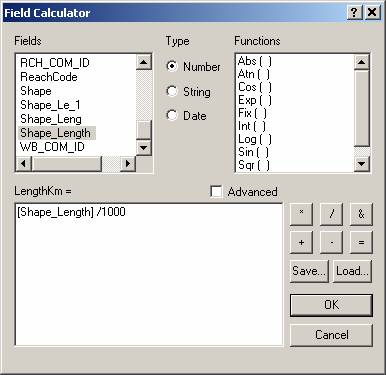
In order to compute distances along the
network we must first compute the length of each edge by assigning the
individual distances manually. To determine the values of the LengthKm attribute, go to Editor > Start Editing, open
the attribute table for HydroEdge, right click
on the LengthKm field, and open the Field
Calculator. Set the result equal to
Shape_Length/1000 (Shape_Length is in meters
in correspondence with your projection) as shown below.
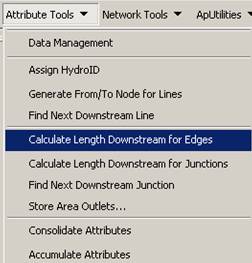
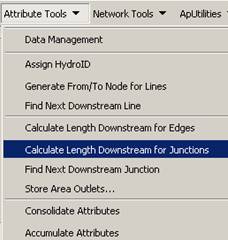
Now we can use the Calculate Length
Downstream for Edges tool to calculate length downstream from all edges in
our network. Right click on HydroEdge and open its
Attribute Table. You will find LengthDown
column with <null> values in it, and the LengthKm
with the needed values to support its calculation.
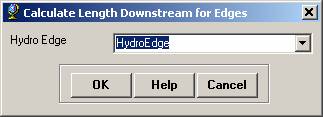
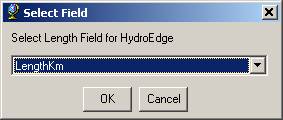
Go to Attribute Tools > Calculate
Length Downstream for Edges. Select HydroEdge
for calculating Downstream Length and LengthKm
as the Attribute Field for HydroEdge. Click OK.
You will now use the Calculate Length
Downstream for Junctions to calculate length downstream for all junctions.
Right click on HydroJunction and open the Attribute
Table for HydroJunction. You will find LengthDown column with <null> values in it.
Similarly, Go to Attribute Tools >
Calculate Length Downstream for Junctions. Select HydroJunction
for calculating Downstream Length and LengthKm
as the Attribute Field for HydroEdge. Click OK.
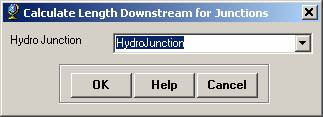
The values of downstream length from the selected junctions will appear on the LengthDown column of the Attribute table. Close the attribute table for HydroJunction.
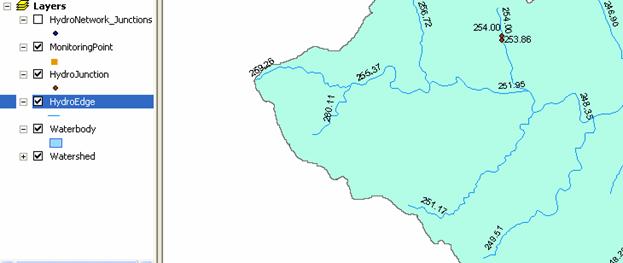
Now, lets figure out what you have been doing. Open the attribute table for HydroJunction, and select Properties. Click the Labels tab and edit the Label properties to set the Label attribute to LengthDown. Make sure the box for “Label Features in this layer” is checked.
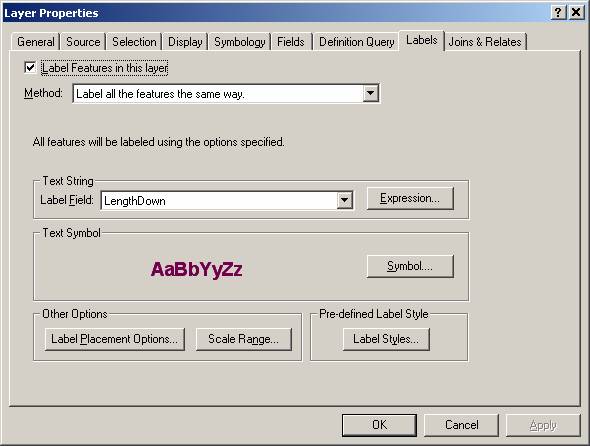
Similarly, set the Label
attribute of HydroEdge to LengthKm.
If you zoom in near the downstream outlet of the
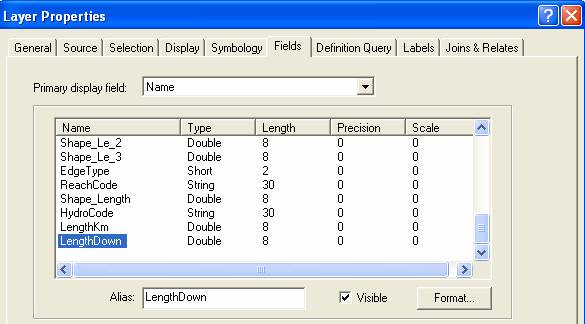
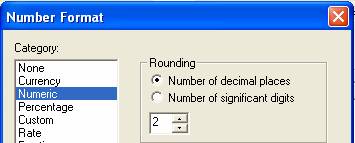
The default display for fields may have too many decimal places to be easily readable. To correct this in Arc Map, right click on the theme name, go to Properties, select Fields, select the attribute whose display you want to alter, then click Format, and select the format you want, in this case a two decimal display of LengthDown. Click Ok, and then Apply and turn off the labeling and then turn in it on again and you’ll see the labels in the new length format.
To be turned in: What
is the maximum flow distance from any HydroJunction
in the
Congratulations, You are done with exercise #5!
Summary of Items to be turned
in:
1. A map showing the Arc Hydro framework
dataset for the
2. A map of the features selected by the
Trace Upstream task. How many features are selected by this trace?
3. A map of the features selected by the
Trace Downstream task. How many features are selected by this trace?
4. Make a table that lists the five feature
classes: HydroEdge, HydroJunction,
MonitoringPoint, Waterbody
and Watershed and list the attributes that were added to these feature classes
by the process of applying the ArcHydro schema. The gage on the
5. What
is the maximum flow distance from any HydroJunction
in the
Go
to Class
Home Page