Precipitation: To view mean annual precipitation data, place a
4/29/97 for Gishydro97
Important: The soil water balance algorithm described in this exercise is different than that used in the accompanying Morocco exercise on this CD-ROM. A brief explanation of these modifications is described below. For more details see the accompanying DRAFT paper:
The exercise requires Themes, Scripts, and Text files which are automatically loaded by a Project file which is provided for you. The files needed for this exercise can be found in the directory ~/soil/texas/gisfiles on the Gishydro97 CD-ROM.
To run this exercise, first copy all the files in ~/soil/texas/gisfiles to your local hard disk. Make sure you keep the project file and data files in the same directory. IMPORTANT! If you copy the actual directory "gisfiles" with the files inside, then you need to make sure your machine has write permission to this directory and all directories above this directory. On a PC you can change the properties of a file or a directory by highlighting that particular file and then selecting File / Properties using the File Manager. Make sure the box next to the words "read-only" is not checked for the gisfiles directory. You should find the following files in the directory ~/soil/texas/gisfiles..
Themes:
txbndp.shp, .shx, .dbf: polygon coverage of the Texas border
txrun2.shp, .shx, .dbf: polygon coverage of 0.5 degree cells that
will be used as the model units. Attributes of this theme that will be
displayed include: mean annual precipitation (fieldname="wprec"),
mean annual temperature("wtemp"), and total soil water holding
capacity ("wholdavg").
txrad5.shp, .shx, .dbf: polygon coverage of 0.5 degree cells containing
net radiation estimates.
Tables:
prec_tr.txt : table of mean monthly precipitation for each computational
cell
radeq.txt: table of 12 monthly values of net radiation equivalent
in mm of water
Legend Files:
prec.avl : saved Legend for precipitation data
rad.avl : saved Legend for open water evaporation data
temp.avl : saved Legend for temperature data
whold.avl : saved Legend for water-holding capacity data
Other:
texas.ctl : control file for the water balance program
sbal.f90 : source code for FORTRAN version of soil water balance
program.
soilbal.exe : executable FORTRAN code (compiled for Windows 95)
texas.ctl : control file for running Avenue soil water balance example.
txfort.ctl : control file for running FORTRAN soil water balance
example.
The input data for this version of the soil water balance model are precipitation, temperature, total water-holding capacity, and net radiation.
Mean monthly temperature and precipitation estimates interpolated onto a 0.5 by 0.5 mesh were obtained from Cort Willmott at the University of Delaware. These data come from the "Global Air Temperature and Precipitation Data Archive" compiled by D. Legates and C. Willmott. The monthly precipitation estimates used in this study were corrected for gage bias. Data from 24,635 terrestrial stations and 2,223 oceanic grid points were used to estimate the global precipitation field. The climatology is largely representative of the years 1920 to 1980 with more weight given to recent ("data-rich") years (Legates and Willmott, 1990).
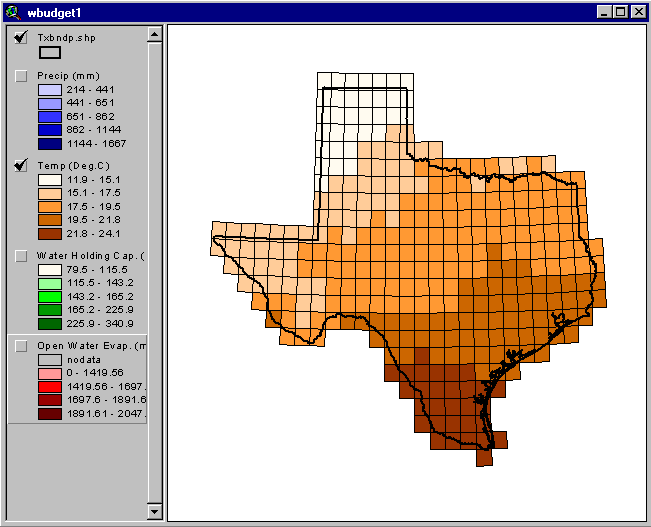
0.5 degree boxes covering the land surface of Texas have been clipped for use in this exercise. Mean annual precipitation and temperature estimates are attributes of the shapefile txrun2.shp: "wprec" and "wtemp." The Themes that you see called "Precip" and "Temp" both reference the file txrun2.shp.
To view the climate data in the project sbudget.apr simply do the following:
Precipitation: To view mean annual precipitation data, place a ![]() next
to the Theme "Precip."
next
to the Theme "Precip."
 Click
on Image for Larger View of Precipitation
Click
on Image for Larger View of Precipitation
Temperature: To view the mean annual temperature, remove the
![]() box next to the Theme "Precip"
and add a
box next to the Theme "Precip"
and add a ![]() next to the Theme "Temp."
next to the Theme "Temp."
 Click
on Image for Larger View of Temperature
Click
on Image for Larger View of Temperature
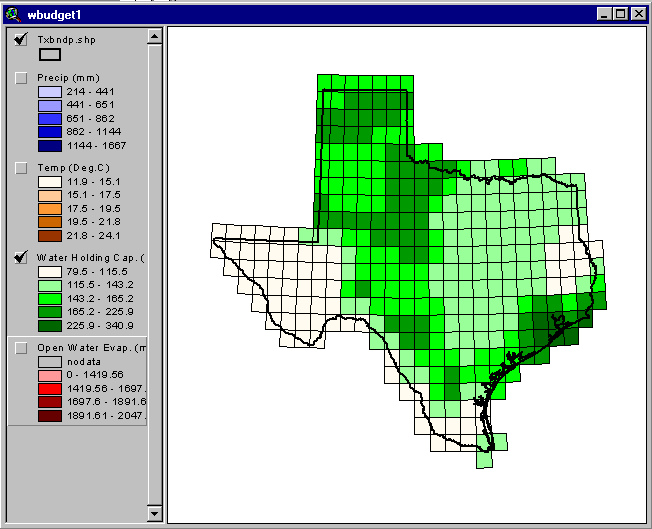
Global estimates of "plant-extractable" water capacity (or total water-holding capacity) on a 0.5 degree grid were obtained via anonymous ftp from the USGS Geophysical Fluid Dynamics Laboratory. This data set was compiled for a Master's thesis written by Krista Dunne at the University of Delaware. Information about sand, clay, organic content, plant rooting depth, and horizon thickness was used to estimate the total water-holding capacity. An important source of data used in this analysis was FAO's Digitized Soil Map of the World (FAO, UNESCO, 1974-1981). The global average soil water-holding capacity estimate is 86 mm.
These water-holding capacity estimates have also been attached as an attribute to the coverage txrun2.shp. These values are contained in the field "whold." To view this data, remove the check mark next to the Theme "Precip" and check the box next to "Water Holding Cap".
 Click
on Image for Larger View of Water Holding Cap.
Click
on Image for Larger View of Water Holding Cap.
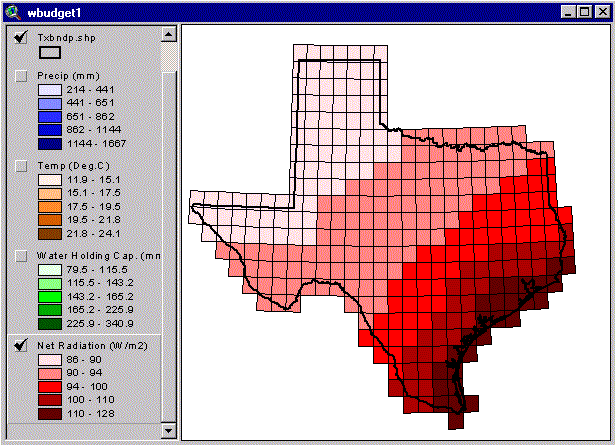
Global mean monthly Surface Radiation Budget data generated using International Satellite Cloud Climatology Project (ISCCP) and Earth Radiation Budget Experiment (ERBE) data are available for a 96 month period extending from July 1983 to June 1991. The data are given on the ISSCP equal-area grid which has a spatial resolution of 2.5 degrees at the equator. Using this data, monthly average and mean annual and mean monthly values of net radiation were computed for this 8 year period. To make computations easier, the radiation data were resampled to the same resolution as the climate and soils data (0.5 degree cells). These data are shown in the figure below.
 Click
on Image for Larger View of Net Radiation
Click
on Image for Larger View of Net Radiation
It is seen that wetter areas of East Texas have a higher net radiation. This is primarily due to a greater amount of solar radiation absorption by water on the land surface and water vapor in the atmosphere. In addition, greater cloud cover and water vapor in the atmosphere trap a larger percentage of the longwave radiation emitted from the earth. Spatial variation of surface albedo also contributes to this trend because drier, less vegetated areas in West Texas tend to have higher albedos, causing more of the incoming shortwave radiation to be reflected.
The soil-water balance model uses a simple accounting scheme to predict soil-water storage, evaporation, and water surplus. Surplus is precipitation which does not evaporate or remain in soil storage and includes both surface and sub-surface runoff. The conservation of mass equation for soil-water can be written as follows:
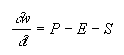 (1)
(1)
In this equation, S is surplus, P is precipitation, E is evapotranspiration, w is soil moisture, and t is time. Horizontal motion of water on the land surface or in the soil is not considered by this model. Snow melt was also not considered in these computations, but this probably does not introduce significant error for a study in Texas. Note that the modeling units on which the mass balance is being computed are 0.5 degree boxes with a depth equal to the total water-holding capacity of the soil.
The actual calculations to evaluate Equation 1 are done on a daily basis in the program. Values of the monthly precipitation (P) are divided by the number of days in the month to give average daily values. E (evaporation) is estimated using a derived relationship between Bowen ratio and soil moisture (described further below) and net radiation data. The runoff or water surplus (S) in each day is estimated using a similarly derived relationship between runoff coefficient and soil moisture. A trial calculation is done to find the end of day storage and if this exceeds the soil moisture capacity, the excess soil moisture is added to the water surplus and the storage is reset to the soil moisture capacity before the next day's computations are done. This algorithm is limited by the fact that it assumes that a month's rain falls as a gentle mist instead of in concentrated daily amounts with zero rainfall in between. This simplification is offset by allowing a small amount of runoff or water surplus in each day, as occurs with a soil slowly draining to a stream. The algorithm used here can also be applied with daily data files when such data are available and then its daily results are more realistic.
Using mean monthly climate values, the computations are repeated for several years in sequence using the same input data until the computed soil moisture levels in each month converge to constant values. These values then represent average monthly soil moisture levels.
A mean annual map of Bowen ratios was created for the state of Texas by using information about mean annual evaporation (developed from a surface water balance) and mean annual net radiation. An initial map of mean annual soil moisture was created using soil water balance calculations and the more traditional approach to estimating evapotranspiration, multiplying a soil moisture extraction function by a potential evapotranspiration estimate. For each 0.5 degree cell in Texas, the average Bowen ratio was plotted against the average soil saturation. The initial relationship derived is presented here.
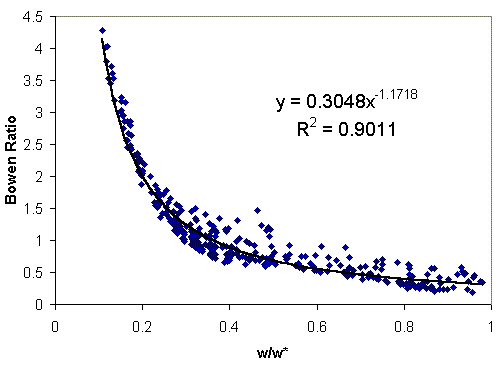 Click
on Image for Larger View of Graph
Click
on Image for Larger View of Graph
The hypothesis being tested is whether this relationship derived from a steady-state values at different points in space can be applied to time-varying calculations at individual locations. During the soil water budgeting calculations, an estimate of soil saturation is available at each step so the Bowen ration can be estimated using a graph like the one above. Then the amount of evaporation can be estimated using the following equation.

Er is the radiation equivalent in depth of liquid water and B is the Bowen ratio. Because this method relies on computed soil moisture values, the relationship between Bowen ratio and soil saturation will change when this new method is implemented because new soil moisture values will be computed in each cell. For this reason, an iterative procedure in which the soil-water budget computations are repeated for each cell (using the new functional relationship) to see how the Bowen ratio versus soil saturation relationship changes. This relationship became tighter after only a few iterations. The curve that resulted after three iterations is shown below. The relationship shown here is what is used in the calculations below.
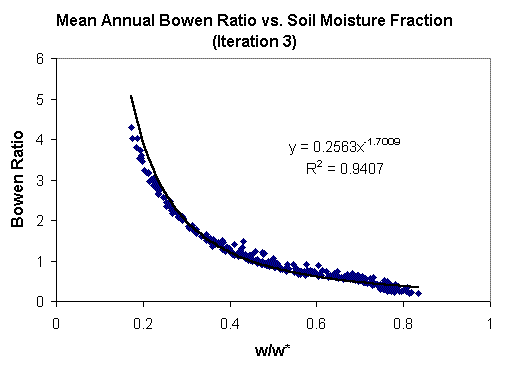 Click
on Image for Larger View of Graph
Click
on Image for Larger View of Graph
Estimating S (surplus)
In a similar manner to that for estimating evapotranspiration, a relationship between runoff coefficient and soil saturation was developed. This was done using a map of mean annual runoff developed in a surface water balance study and the soil saturation map resulting from initial soil water budget calculations. A graph of this type is used in the soil water balance calculations to estimate a daily release of runoff or water surplus. As with the Bowen ration vs. soil saturation relationship, the runoff coefficient vs. soil saturation relationship will change when new soil saturation values are computed. After three iterations, the runoff coefficient vs. soil saturation relationship looks like this:
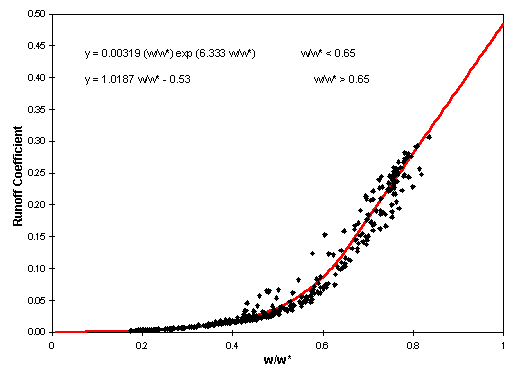 Click
on Image for Larger View of Graph
Click
on Image for Larger View of Graph
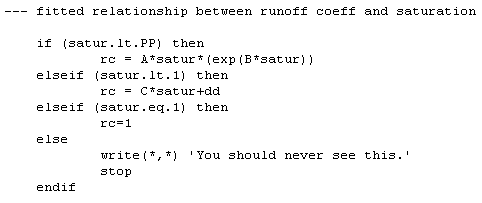
This is the relationship used in the sample calculations presented below. There is a notable problem with this relationship in that the fitted equation yields a runoff coefficient of about 0.5 when the soil is saturated, but in reality a runoff coefficient of 1 is expected when the soil is saturated. In the program used below, runoff coefficient of 1 was assumed whenever the soil became saturated.
To run the Avenue version of the water balance program, first make "Precip
(mm)" the active theme and select a set of cells at which computations
will be made using ![]() . Depending
on your computer speed, this computation may take some time so selecting
10 cells or fewer is recommended for demonstration purposes. Two input
files have already been created for you. These contain monthly estimates
of precipitation (prec_tr.txt) and equivalent water depth of net
radiation (radeq.txt) for each cell that you see in the View.
. Depending
on your computer speed, this computation may take some time so selecting
10 cells or fewer is recommended for demonstration purposes. Two input
files have already been created for you. These contain monthly estimates
of precipitation (prec_tr.txt) and equivalent water depth of net
radiation (radeq.txt) for each cell that you see in the View.
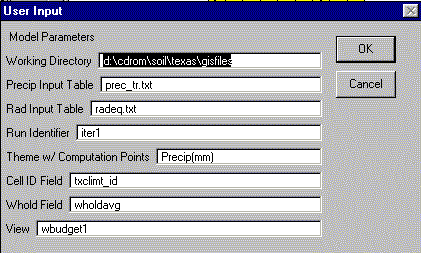
Select Run Soil Balance under the Programs menu. You will
be asked whether you wish to continue with selected cells (say yes), and
then you will be prompted to select a control file. Select texas.ctl.
This file contains a list of the parameters which are presented to you
as shown here:
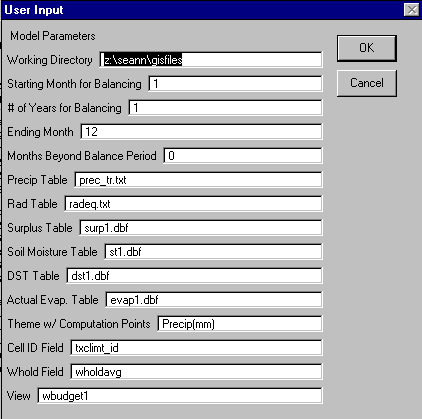
The parameters in this window are:
Working Directory: the directory to which the output files are written
Starting Month for Balancing: first month for water balance computations. The default value is 1 for January.
Number of Years for Balancing: this corresponds to the number of years of data in your climate data file. The default is 1 year.
Ending Month: last month for water balance computations. The default value is 12 for December.
Months Beyond Balance Period: The default value is 0.
Precip Table: The input table specifying the precipitation input data (mm/mo.).
Rad Table: Input table containing water equivalent to the net radiation values (mm/mo.).
Surplus Table: The output table containing the computed water surplus results (mm/mo.)
Soil Moisture Table: The output table containing the soil moisture level at the beginning of each month (mm).
DST Table: The output table containing the soil moisture increments from one month to the next (mm/mo.)
Actual Evap. Table: The output table containing the actual monthly evaporation (mm/mo.)
Theme w/ Comp. Points: The Model Unit Theme defining the spatial units on which the computation is to be performed.
Cell ID Field: The key field in the Model Unit Theme that indexes the spatial units and is used in the field or column header on all the time series tables of the computed values to indicate the spatial unit to which each time series is referenced.
Whold Field: The Field in the Model Unit Theme which specifies the total water holding capacity of the soil (mm).
View: The name of the View containing the computational Theme.
Don't change the names of the input files for precipitation or net radiation but you can change the names of the output files if you want to run several different cases and compare the results. Check the working directory to make sure that this is the location where you want files to be written.
Here is an example of the input precipitation and radiation data used in in this computation. The 12 rows in this table contain data for the 12 months, January to December. The data structure of defining the spatial units with fields and the time units with records is cumbersome when there are many more spatial units than time steps (as in this case), but this data structure is convenient when longer time periods or shorter time steps need to be considered.

Before the calculations are started, you will be presented with this message box, which gives you an opportunity to save the control file you have used so that if you have made changes to it, you can use the new control file again later. For the first time you run this exercise, select No. If you run the exercise twice with the same control file, you will create duplicates of each output file. If you hit Yes at this point you will be prompted for the name you wish to assign to your new control file.

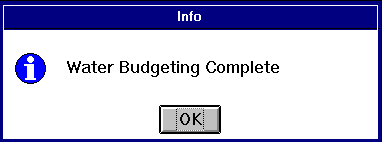
Once the water balance calculations are completed you will see a message box like this. Hit OK, and the program is terminated.
As you will notice, the cells where computations are made turn red.
The red blocks are ArcView graphics and are
kept at the end of the program to indicate where computations have been
made. Keeping these graphics may be helpful for part 4; however, if you
want to get rid of these graphics, you can select Edit / Select All Graphics
and then Edit / Cut Graphics.
Four dBase files have been created by the script "swbaltx.ave" that was initiated when you selected "Run Soil Balance." "Surp1.dbf" contains computed surplus. "St1.dbf" contains soil moisture storage. "Dst1.dbf" contains change in storage, and "evap1.dbf" contains computed evaporation. Here is an example of the computation reuslts for cell C386:
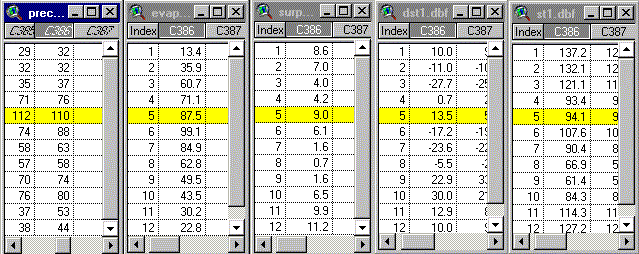
The quantities for the month of May in unit C386 are highlighted. This unit has a water holding capacity of 171.8 mm. In May, 110 mm of precipitation produces 87.5 mm of evaporation, a water surplus of 9.0 mm, and a change in soil storage of 110 - 87.5 - 9.0 = 13.5 mm. The storage at the beginning of the month is 94.1 mm, so the storage at the end of the month is 94.1 + 13.5 mm = 107.6 mm which is taken as the starting storage for June.
Plotting a Chart of the Results
A script has been written which makes it easy to create a Chart of the
results from a selected table. To plot a table of your choice, click on
![]() and then click on a cell where
the soil water balance has been computed. You will be asked to identify
the key field. Choose "txclimt_id" as shown below.
and then click on a cell where
the soil water balance has been computed. You will be asked to identify
the key field. Choose "txclimt_id" as shown below.

You will then be allowed to choose a table from which to plot data. The input and calculated time series tables prec_tr.txt, pevall.txt, evap1.dbf, stm1.dbf, and surp1.dbf will be among your choices. You cannot plot data for cells which were not selected when soil water balance computations were made.
Notes: The executable version of this program has only been compiled for a PC and should work in a Windows 95 or Windows NT operating system. The FORTRAN90 source code is also included so that you can compile on your own operating system if desired. The source code is a single text file called "sbal.f90." The instructions below assume that a compiled program named "soilbal.exe" exists.
This FORTRAN program is less flexible than the Avenue script described above, in that it requires that computations are made for 12 months only, starting in January.
The Avenue script for computing the soil water balance is not a particularly efficient program. So when it was desirable to make repeated computations (with slight variations) over a large area, a FORTRAN program was used. The input file for this program is a text file created using an Avenue script.
To run this Avenue script, first select all the cells in the Theme "Precip(mm)"
using ![]() . Then select Programs
/ Write FORTRAN input which initiates the script "soilbin.ave."
You will be asked if you wish to run the program on selected cells. Say
"yes" to continue. Select the control file txfort.ctl
and you will be shown the following list of program parameters:
. Then select Programs
/ Write FORTRAN input which initiates the script "soilbin.ave."
You will be asked if you wish to run the program on selected cells. Say
"yes" to continue. Select the control file txfort.ctl
and you will be shown the following list of program parameters:
The parameters in this window are:
Click OK to the "User Input" window and then No. You will now be prompted with a window titled "Fitted Equation Input." The numbers that you see are parameters used to fit equations to the Bowen ratio vs. soil saturation and runoff coefficient vs. soil saturation curves. These equations have the following form:
![]()
Click O.K. for the default parameters and the script will run. The status bar at the bottom of ArcView indicates the progress made by the program.
The script ("soilbin.ave") you have run actually creates 3 files:
To run the FORTRAN program, select the menu item Programs / Run External FORTRAN. THIS PROGRAM CALLS THE FILE "soilbal.exe" which will only run on PC's with Windows 95 or Windows NT. A DOS window will come up and after a few seconds disappear. When this DOS window disappears, the program has completed. Click OK on the ArcView message box.
The results of the FORTRAN program are written to a text file called iter1out.txt. This file is comma delimited so you can add this file to ArcView by clicking on the "Tables" Icon in the Project window and then clicking the Add button. In the "Add Tables" menu that pops up, select Add Tables of Type (*.txt), and then add the file "iter1out.txt."
This file contains one record for each cell in Texas and monthly values are in Fields: 12 values of precipitation, 12 values of net radiation, 12 values of surplus, 12 values of evaporation, and 12 values of soil moisture. This format is a different than that created by the Avenue program and has both advantages and disadvantages. One advantage is that the output data can be joined (using the menu item Table / Join) directly to the polygon coverage for making maps. To do this, the two key fields that can be joined are "Cellid" in the table iter1out.txt and "txclimt_id" in Precip(mm).
That's all for now!
These materials may be used for study, research, and education, but please credit the authors and the Center for Research in Water Resources, The University of Texas at Austin. All commercial rights reserved. Copyright 1997 Center for Research in Water Resources.
