CE 394K.2
Ex 3
Prepared by,
Ernest To
March 5, 2007.
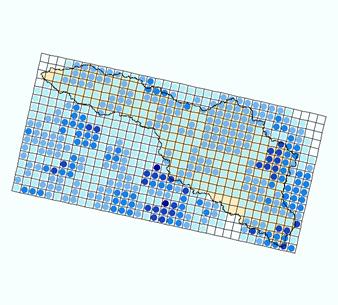
To be turned in: A screen capture of the animation window with
all the data displayed shown above.
Below is a screenshot of the animation window.
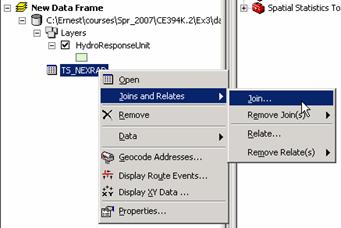
Interestingly, I found that most cells in HydrologicResponseUnit shapefile “flashed” only once throughout the duration of the animation. This was contrary to expectation because we know from the TS_NEXRAD table that there can be multiple rainfall records for a given cell (i.e. one-to-many relationship between cells and records). So some of the cells should flash multiple times.
This issue may be related to the attribute-join mentioned in page 10 of the instructions. An attribute-join can be one-to-one or many-to-one, but not one-to-many. By forcing the join between the two layers, each HRU cell was joined to only one of its associated time series records and the rest were omitted. Out of the 1942 records in TS_NEXRAD, only 300 were joined to HydrologicResponseUnit. It is probably because of this that the cells only flashed for a maximum of one time.
I applied a partial fix for the above issue. Instead of joining the TS_NEXRAD table to the HydrologicResponseUnit featureclass, I joined the attribute table of the HydrologicResponseUnit featureclass to the TS_NEXRAD table. The problem with this method was that the shape properties of HydrologicResponseUnit (i.e. the cell squares) cannot be transferred to TS_NEXRAD through an attribute-join. So somehow I had to find a way to work with a flat table that had no spatial features.
My workaround was to calculate the coordinates of the centroids of the cells in the attribute table of HydrologicResponseUnit prior to the join. Then once the join was completed, I used those coordinates to display the TS_NEXRAD data as points. Finally, I applied symbology to the points and then animated them using animation manager. Please find a video of the animation on:
http://www.ce.utexas.edu/prof/maidment/GradHydro2007/Ex3/Soln/Ex3.avi
Below is the legend for the animation:
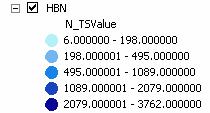
The units are in hundredths of mm rainfall.
For the interested reader, below is a list of my steps:
1. Obtain centerpoint coordinates of all the HydrologicResponseUnits_box cells.
a. Open up the attribute table of HydrologicResponseUnits_Box and add two fields, X and Y. Make both fields double fields.
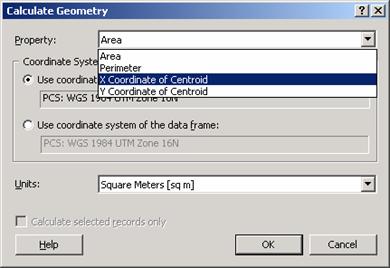
b. Right click on the X column header and select Calculate Geometry.
c. Select X coordinate of centroid and hit OK. This will populate the X column with the X-coordinates of the cell centroids.
d. Do the same for the Y column, but this
time choose to calculate the Y
Coordinate of Centroid.
2. Instead of joining the TS_NEXRAD table to the HydrologicResponseUnit_Box featureclass, join the attribute table of the HydrologicResponseUnit_Box featureclass to the TS_NEXRAD table.
3. Display the XY data in the joined table using the X and Y columns in the joined table. Modify the symbologies to show the gradients in TSValues.
4. Export the event class to a new featureclass in NEXRAD_SanMarcos.mdb. Then animate the featureclass as per the procedures in Exercise 3.