Introduction
to ArcGIS for Brushy Creek
Course exercise for CE 374K Hydrology
University of Texas at Austin
Prepared by Sili
Liu and David R. Maidment
January, 2012
Description
A geographic information system (GIS) is a system designed to capture, manage, analyze, and display all forms of geographically referenced information. It allows us to view, understand, interpret, and visualize data in many ways. This exercise introduces you to a fundamental understanding of GIS and describes how information is derived from the spatial data in a map. In addition, you will try some basic operations and make your own maps.
Content
· Computer and Data Requirements
2. Viewing and querying the layers
3. Creating a flood map of Williamson County
4. Calculating the length of the Brushy Creek
· Appendix 1: Installation of the ArcGIS Desktop on your computer
After completing this exercise, you will be able to
§
Understand how
data is managed in ArcGIS in thematic layers.
§
Visualize and
query the attributes of those data layers.
§
Create a flood map
of Brushy Creek in Williamson County, TX.
§
Do some simple
calculations using the data stored in an attribute table.
Computer and Data Requirements
To complete course exercises, you need the following software:
§ ArcGIS Desktop (Only one product in this category is required.
ArcView 10
ArcEditor10
ArcInfo 10
We are going to use ArcInfo 10, the most powerful of these options. You can follow the steps in Appendix 1 to install ArcGIS 10 on your personal computer, or you can use a computer in the Learning Resource Center on the third floor of ECJ, where the software is already installed.
The
data of this exercise is from the ArcGIS online at http://www.arcgisonline.com/home/
At
the upper right of the display, change Show: Web Content Only to Show:
All Content.
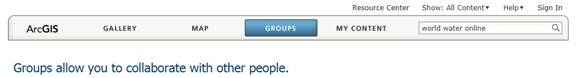
Click
Groups and search for World
Water Online.
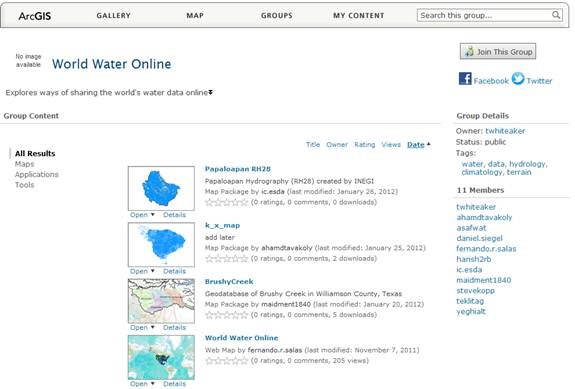
And
you’ll see a Map Icon called BrushyCreek:
Geodatabase of Brushy Creek in Williamson County, Texas
Click on the BrushyCreek Map and you’ll open up the
following page, and you want to Open in
ArcGIS 10 for Desktop
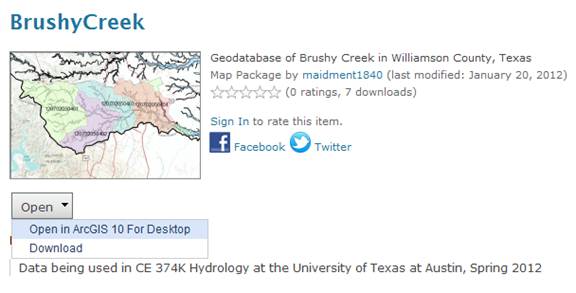
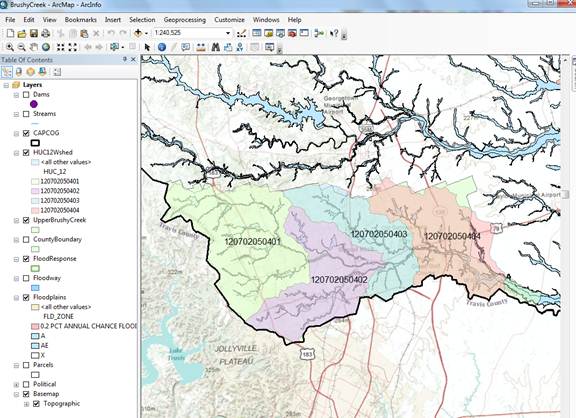
And this automatically opens up ArcGIS 10 Desktop and
displays the data in a map. Pretty cool!
2. Viewing and Querying the
Layers
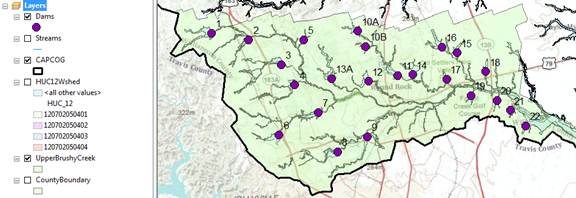
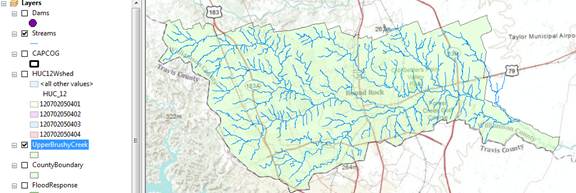
In the list of layers on the left of the map, you can click the display of each layer on or off with the check box to the left of the layer name. For example, if you check on Dams and check off HUC12Wshed, you’ll get a map like this:
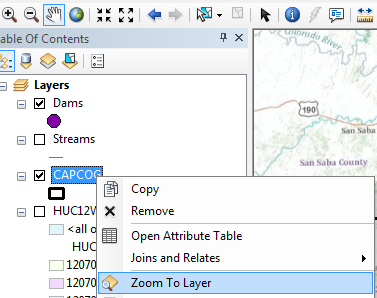
You can zoom to any layer you would like to see by right
clicking and selecting![]() ,
but remember to open that layer by checking the box in front of it first. For
example, let’s zoom to the CAPCOG
layer, and see what happens.
,
but remember to open that layer by checking the box in front of it first. For
example, let’s zoom to the CAPCOG
layer, and see what happens.
If you mess up the display at some point and want to return
to the display you had before, hit the ![]() arrow at the top of the display.
arrow at the top of the display.
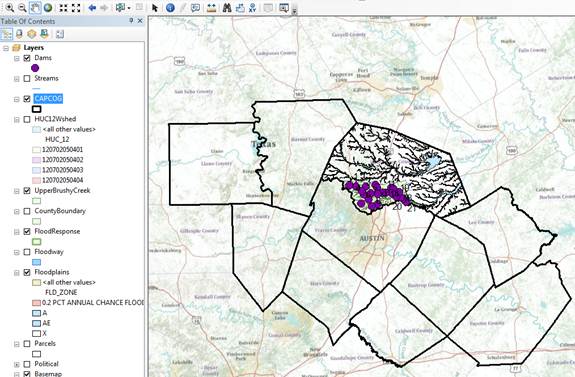
These are the 10 counties in the Capital Area Council of Governments. We are working in Williamson County where the floodplain map shows below, and just south of Williamson County is Travis County where Austin and UT are located.
You can access the attributes of a particular feature in a layer by opening the attribute table. For example, right click on CAPCOG and select Open Attribute Table

If you click on the row for Williamson county in the table, notice how it is selected also in the map. This is a key idea of GIS – the association of the geometry of a feature with descriptive attributes in a table.
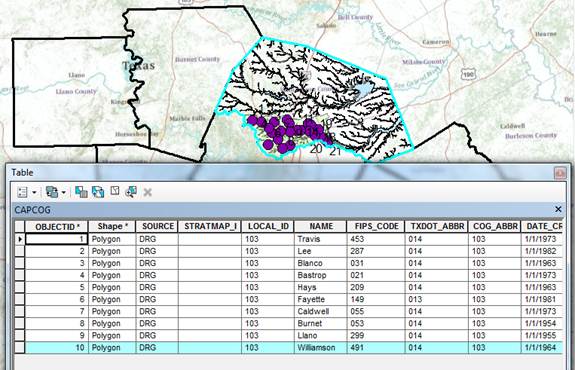
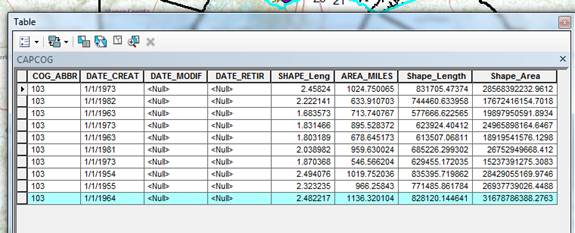
If you scroll along to the end of this table, you’ll see various length and area measures. The length refers to the length of the boundary of the polygon describing Williamson County and area the area of this polygon.
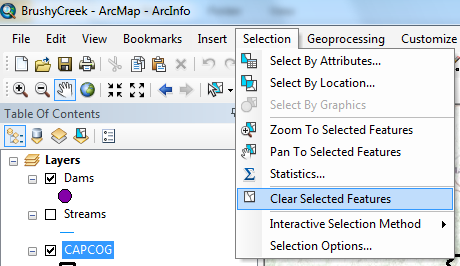
Use Selection/Clear Selected Features to unselect Williamson County in the display.
To be
turned in: What is the area of
Williamson County in Square Miles?
3. Creating a flood map for
Williamson County
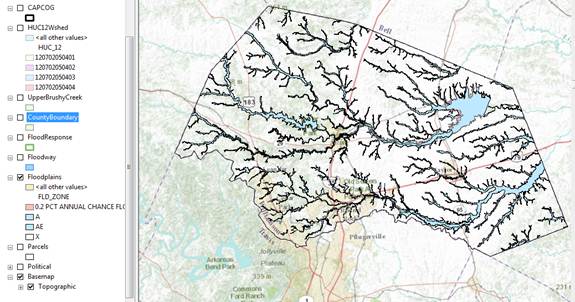
Now, let’s suppose we want to create a flood map for Williamson County and put that in a report being written in Microsoft Word. Turn off the display of all the layers except for Floodplains and BaseMap, and zoom into the layer CountyBoundary
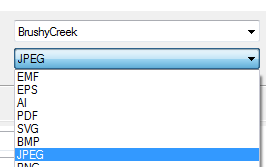
In ArcMap, select File/Export Map
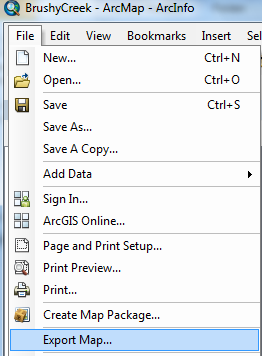
and in the formats suggested, select JPEG
Put the resulting file into a workspace that you can access for your homework report
And you’ll find you’ve got a file there that looks like this:
![]()
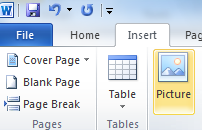
In Microsoft Word, use Insert/Picture to select this file and add it to your homework report.
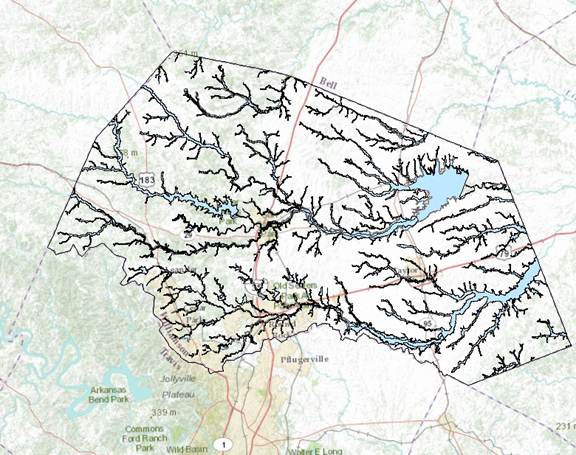
To
be turned in: A flood map of Williamson
County.
4. Calculating the length of
Brushy Creek
Turn off the display of all the layers except for Streams, UpperBrushyCreek and Basemap, and zoom in to the Brushy Creek watershed.
Turn on the streams layer in the display, and open the attribute table by right clicking on the name of the layer. Use the Select by Attributes Tool at the top left of the table to select the target river.
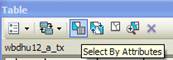
In
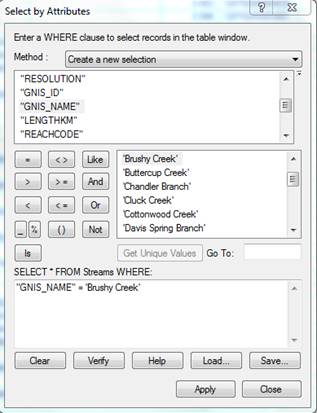
the Select by Attributes window, click on GNIS_NAME,
=, Get Unique Values and then double click on Brushy Creek to form the expression. Click on Apply and close the Select
by Attributes window.
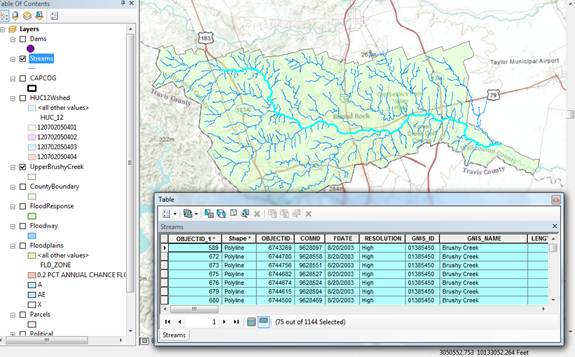
After making the selection, you will see that the
Brushy Creek is highlighted in the map. Reopen the attribute table and at the
bottom click on ![]() (show selected
records ), and you should see a display like that below
(show selected
records ), and you should see a display like that below
Scroll across to the LengthKm field, right click on it and select Statistics
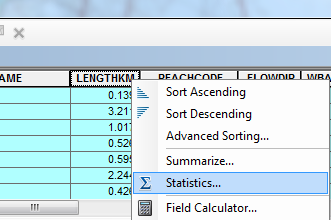
and the resulting display will appear as:
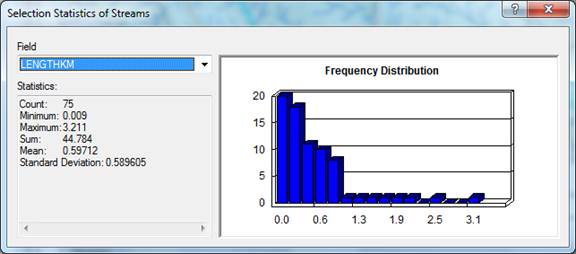
The Sum statistic gives the total value of the LengthKm attribute of the selected features. This is in kilometers and you’ll need to convert the result to miles.
To be turned in: The length of Brushy Creek in miles.
Summary of items to be
turned in:
1. The area of Williamson County in
Square Miles?
2. A flood map of Williamson County.
3. The length
of Brushy Creek in miles.
Instructions for
Installation of ArcGIS Desktop on your Computer
These instructions assume that you have a CD containing ArcGIS for Desktop for student use.
Installation Steps
1. Check supported operating system before the installation at http://resources.arcgis.com/content/arcgisdesktop/10.0/arcgis-desktop-system-requirements.
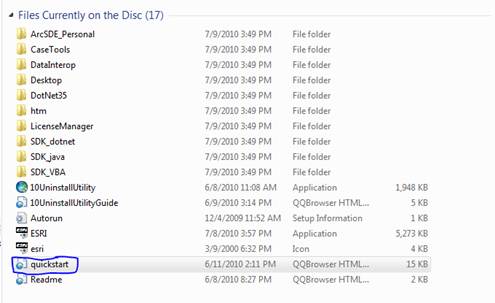
2.
Insert ArcGIS Desktop DVD and in the menu
folder, select quickstart so that you can refer to
the installation guidance.
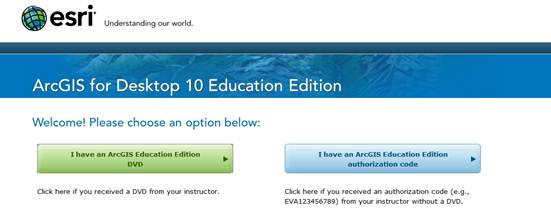
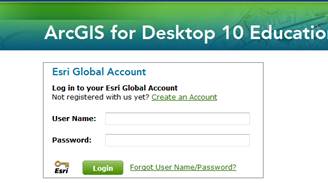
3. Visit
esri.com/EducationEdition to activate your
authorization number first (the 12-digit number is inside your CD cover).
Select “I have an ArcGIS Education Edition DVD”, create your own account, and
enter your authorization number to activate your GIS.
4. Run
ESRI.exe you will see a window like this.
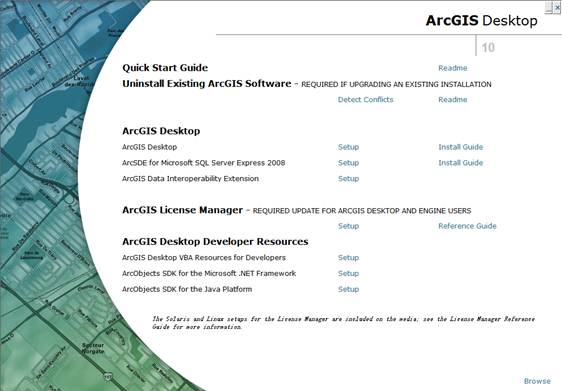
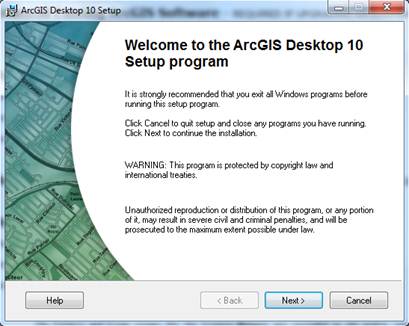
5. Select ArcGIS Desktop and follow the instruction to
complete the installation process. Always select “next” until the installation
has been finished. It will take you some time to complete the installation, so
you can have a cup of coffee and relax during this time.
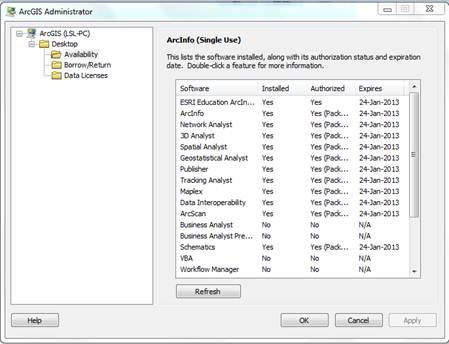
6. Authorize ArcGIS Desktop 10 single use. After the installation, select the desired Single Use product in the ArcGIS Administrator wizard, and click Authorize Now. Select the default option, I have installed my software and need to authorize it. Select Authorize with ESRI now using the Internet, and enter your personal information and your core product authorization number.
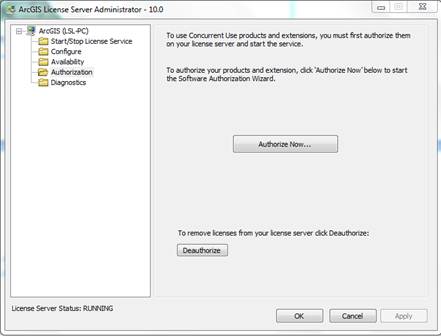
After Authorization, you will see information like
this.
Now
you have successfully install ArcGIS Desktop 10 on your computer. You can begin your trip with this magic software.