CE 394K.2 Hydrology
Introduction to HIS Server
By David R. Maidment and Ernest To
Center for Research in Water Resources
January 28, 2007
Contents
1.
Introduction
HIS Server is a software system that enables you to query
networks of hydrologic observation sites and extract hydrologic observation
data from them in the form of time series of measurements at individual sites
or collections of them. The National
HIS Server provides access to observation data sources such as the USGS
National Water Information System (NWIS) and the EPA Storage and Retrieval
System (Storet). Regional HIS Servers
provide additional information about observation networks for state, local or
academic investigator observation data sources in particular areas. Development of HIS Server is a joint effort
between the CUAHSI (Consortium of Universities for the Advancement of
Hydrologic Science, Inc) Hydrologic Information System project http://www.cuahsi.org/his and the ESRI Water Resources Applications
group in
An observation data source, such as the USGS, may operate one or more observation networks (e.g. streamflow, water quality, groundwater); each observation network is represented by a map of point observation site locations; each observation site may have data on one or more variables; each variable is represent by a collection of values; each value is a number that has associated with it a time of measurement and possibly a qualifier (such as < ) to help interpret the value. The time series of values may be recorded regularly or irregularly in time, within a time range from a beginning date and time to an ending date and time. The observation sites are indexed by a SiteID and the variables by a VariableID. The definition of variables is consistent across all sites in a particular network, but differs from one network to the next. For example, the USGS NWIS and EPA each have a set of more than 9000 parameter codes that describe the data they contain but these codes are not compatible with one another (see http://nwis.waterdata.usgs.gov/usa/nwis/pmcodes and http://www.epa.gov/STORET/legacy/ref_tables.htm for details). The attached VariableCode.xls file contains the parameter codes for NWIS and Storet.
NWIS Analyst is a graphing and statistical characteristics routine developed by Jeff Horsburgh at the Utah Water Research Laboratory for use with data from the NWIS observation networks, http://water.usu.edu/nwisanalyst/. It takes observation site and variable identifiers, and a period of record, and enables the plotting and statistical interpretation of NWIS data.
2. Before
you start…
Use
Internet Explorer 6.0 or above
Please
make sure that are using Microsoft Internet Explorer 6.0 or above. It has been observed that certain map
commands on the HIS server do not respond when using Mozilla Firefox or other
internet browser.
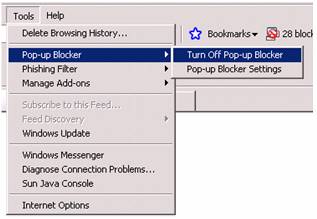
Turn
off pop-up blocker
Please
make sure that you have all pop-up blockers turned off. For Internet Explorer, look under the main
menu, select Tools, scroll down to Pop-up Blocker, and select Turn Off Pop-up Blocker.
For
the Yahoo Toolbar, click on the pop-up icon and de-select Enable pop-up blocker.
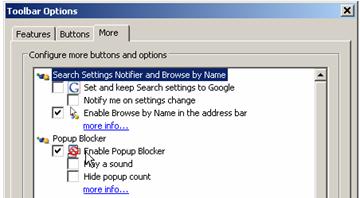
For
the Google Toolbar, click on the Settings
icon in the toolbar and select Options…
Then click on the More tab and de-select
Enable Popup Blocker.
|
|
|
3. Using HIS Server
Open an Internet Explorer web browser and go to the URL http://his.crwr.utexas.edu/his You will see an overview map of the nation as shown below:
Use the Zoom In button ![]() at the left hand end of the map window and
zoom in to a local region around
at the left hand end of the map window and
zoom in to a local region around ![]() on it – these are USGS NWIS sites, and green
triangles
on it – these are USGS NWIS sites, and green
triangles ![]() – these are EPA Storet sites.
– these are EPA Storet sites.

If you zoom in to the wrong place and want to get back to
the whole map, you can use the Full
Extent button ![]() to get back the map of the whole nation. If you want to get a slightly larger view of
map, you can use the Zoom Out button
to get back the map of the whole nation. If you want to get a slightly larger view of
map, you can use the Zoom Out button
![]() . If you want to just move the map around on
the screen, you can use the Pan
button
. If you want to just move the map around on
the screen, you can use the Pan
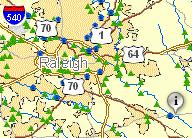
button ![]() . Now, lets zoom in a bit more around Raleigh
and you see more detail – the maps in the server have a scale-dependant display
that increases the degree of detail as you view smaller areas.
. Now, lets zoom in a bit more around Raleigh
and you see more detail – the maps in the server have a scale-dependant display
that increases the degree of detail as you view smaller areas.
4. Identifying Sites
We want to obtain data for the ![]() on the map toolbar (this can also be invoked
using Control-Mouse Click). Its located just to the South-East of
on the map toolbar (this can also be invoked
using Control-Mouse Click). Its located just to the South-East of ![]() icon show up over the site that you
click. Pretty cool!
icon show up over the site that you
click. Pretty cool!
Note: Symantec Client Firewall is known to
interfere with the data response from the HIS server. If Internet Explorer fails to respond (freezes)
after clicking on the map with the Identify tool, please disable the
firewall. See section 6
(Troubleshooting) for more information.
If you expand the Results bar in the map legend, Click on the nwis_DailyValue feature class and expand the information for the selected site, you’ll see quite a lot of data about this site, in particular, its SiteCode of 02087500, which is the USGS identifier number for this NWIS site.
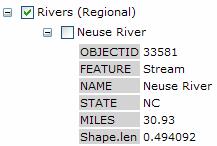
And if you expand the Rivers (Regional) theme, you’ll see
that the river by that site is the
If you expand the EPA Storet theme, you’ll see that this is
also an EPA Storet Site – if you click on the identified feature, you’ll see it
selected as blue ![]() in the map and its attributes are identified –
it is EPA Storet site J4170000 in
in the map and its attributes are identified –
it is EPA Storet site J4170000 in
Ok, this is cool, we are getting some sense of where stations are and what they measured. Daily Values stations in NWIS are those for which daily statistics have been calculated. This includes stream gaging stations because the values reported for them by the USGS are daily averages of the “unit values” of discharge that are recorded usually every 15 minutes at the streamflow gaging sites. The water quality sites, by contrast, have irregularly sampled data that are time stamped with whatever measurement time and date at which they were collected.
If you expand the Map Contents View in the Legend bar,
you’ll see that the HIS has several themes for display and NWIS Water Quality
Stations are shown by green dots ![]() :
:
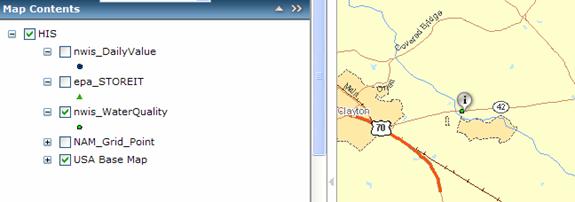
If you click on the Minor Highways theme, you’ll see that this site is located on North Carolina Highway 42. Ok, this is useful information if you wanted to go and visit this site (and something that you most likely could not find out just from querying tabular information about the site).
As you do each query, you’ll find the results indexed under the Results Legend according to the Latitude and Longitude of the point you selected defined in decimal degrees. This is neat because it gives you a sense of your geographic location as you move around the map and also you can check this against the latitude and longitude of the site attributes to make sure that the location of the site is correct on the map. Each new Identify query creates a new display record and after you make a few of these, they pile up. To remove one the identify inquiries, right click on it and select Remove:

5. Site Variables
NWIS
So, we know that our site on the
and click on the Site
Variables tool ![]() , and
again select the site for the
, and
again select the site for the ![]() identify icon show up again, but now expand
the HISID Results window and you’ll see link to the NWIS
Neuse River Near Clayton, NC.
identify icon show up again, but now expand
the HISID Results window and you’ll see link to the NWIS
Neuse River Near Clayton, NC.
If you click on this link, and expand the Site Variables
window, you’ll get some more detailed information about the site. If you click on the scroll down bar ![]() then you should get a display as shown below
that states that this station has NWIS daily values with 28186 records
beginning in August of 1927. (Please note that there are two different
variables both named “Discharge, cubic feet per second”, please choose the one
that returns 29186 records. The other
returns 55 records). I had some
trouble getting this display to come up as shown. The NWIS Variable Code for streamflow is
00060 and if you put this in the Station Variable box and click around a bit it
seems to work. The End Date is not also
in 1927 and this is a shortcoming in our support services that we are working
on fixing. Actually if you divide 28186
by 365, you get 77.22 years, which means that the ending date of the data is
1927 + 77 = 2004 and likely the data end on Sept 30, 2004, because that is the
end of the water year. Let’s download
the data for the entire period of record by changing the end date to any day
that is later than today’s date.
then you should get a display as shown below
that states that this station has NWIS daily values with 28186 records
beginning in August of 1927. (Please note that there are two different
variables both named “Discharge, cubic feet per second”, please choose the one
that returns 29186 records. The other
returns 55 records). I had some
trouble getting this display to come up as shown. The NWIS Variable Code for streamflow is
00060 and if you put this in the Station Variable box and click around a bit it
seems to work. The End Date is not also
in 1927 and this is a shortcoming in our support services that we are working
on fixing. Actually if you divide 28186
by 365, you get 77.22 years, which means that the ending date of the data is
1927 + 77 = 2004 and likely the data end on Sept 30, 2004, because that is the
end of the water year. Let’s download
the data for the entire period of record by changing the end date to any day
that is later than today’s date.
=
Click on Get .CSV. The HIS server will now access USGS’s data banks
in
USGS’s data banks show that there are more records then the previous count of
28186. The count of 29036 days or 79.49
years corresponds roughly to the day of the writing of this document (Jan 29,
2007). This is interesting. Typically USGS data that were collected
before Sept 30 of the previous water year have been reviewed and are thus labeled
as published data. Data collected in the
current water year may not have been reviewed yet and thus still be provisional
(http://water.usgs.gov/provisional.html). Provisional data are subjected to change. It seems that the .csv file contains a
combination of both provisional and published data. Let’s hit download and check it out.
When the above dialog shows up, please select Save. The .csv file is packaged in a .zip file. Once downloaded, double-click on the zip file to open it. You will find a folder named csv. The csv file is inside and is named in the format: XXXXXXXMyData.txt.
Let’s open up the .csv file and scroll down to the very last line.

Indeed, the csv file contains data up to the writing of this document. This tells us that the data series contains both published and provisional data. Very interesting!
Next let’s get a graph of the data. First change the start date to 2006-08-01 and then click on Show Chart in the Site Select Variable window.
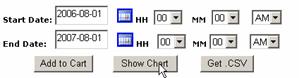
What a nice chart!
Now let’s add the data you have viewed to a cart. This is similar to shopping at Amazon.com or NewEgg.com. This cart allows you to keep on selecting stations and their data without having to wait and download each time. Let’s go back to the Select Site Variables window and click on the Add to Cart for the same period of interest.
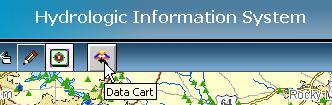
Then view the cart by clicking on the Data Cart icon.
The following window will show up. Let’s select the first item and click Download Data. (Do not use the Get Cart button because it will only get you your selection but not the actual data values.)
In the subsequent dialog box, click Save. Double click on Cart.zip once it has finished downloading.
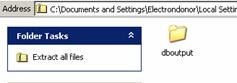
You will find a folder named dboutput. Inside will be an access database file that contains the data in the cart. Let’s open it in Microsoft Access by double-clicking on it.
|
|
|
Inside Access, open the VariableValues table.
You will find all the requested data neatly packaged into an access table.

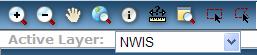
EPA STORET
Now let’s do the same thing again for the EPA Storet
network. Make the Active Layer EPA (if you run into any problems with
this please refer to the Troubleshooting section) and go to the Map Contents
window and turn off the NWIS Daily Values sites and turn on the EPA Storet
sites (the little green triangles). Use
the Site Variables ![]() and repeat the Site Variables Identify
operations. Wait a little bit because it
takes a while to get all the site information, but then if you type a D in the
Variables window, you’ll see Dissolved Oxygen (and other variables beginning
with D that are measured here also). You
can select Dissolved Oxygen Data.
Ok. This is neat.
and repeat the Site Variables Identify
operations. Wait a little bit because it
takes a while to get all the site information, but then if you type a D in the
Variables window, you’ll see Dissolved Oxygen (and other variables beginning
with D that are measured here also). You
can select Dissolved Oxygen Data.
Ok. This is neat.
There are 363 Dissolved Oxygen data values, the first of which was measured on 21 June 1969 at 10:45AM and the last measured at 16 December 1996 at 10:40AM. This is dissolved oxygen in mg/L. Add the selection to the data cart.
Next let’s check out the Nitrogen data. There are 270 values for Nitrite + Nitrate measured as Nitrogen. Add them to the Data Cart too.

Let’s view the cart again:
Click on the Download
Data button and open the VariablesValues
table of the downloaded database. The
database is supposed to contain all the data you need for load calculations in
Exercise 1. However, you will realize
that the nitrogen data (variable code 336-1) are missing. This is an issue that is particular to this
variable and is being investigated right now. The user is advised to download nitrogen data separately
by using the Get .Csv button for now.
Congratulations, you have completed the tutorial.
6. Troubleshooting
HIS Session freezes
Symantec Client Firewall may interfere with the data response
issued from the HIS server. One common
symptom is that the internet browser fails to respond (freezes) after clicking
the map interface with the Identify ![]() tool. While the exact reason for this is not
known yet, the user can use the following work around for the problem:
tool. While the exact reason for this is not
known yet, the user can use the following work around for the problem:
1. Close the Internet Explorer window.
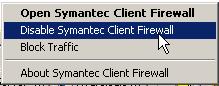
2.
Temporarily disable Norton Firewalll by right-clicking
on the Norton Firewall icon button ![]() in the bottom right hand corner of the Windows
screen and select Disable Symantec
Client Firewall.
in the bottom right hand corner of the Windows
screen and select Disable Symantec
Client Firewall.

3. Based on how long you want to use HIS server, select how long you want the Firewall turned off and then click OK.
4. Open Internet Explorer and navigate to his.crwr.utexas.edu\his\.
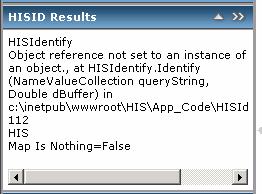
HISIdentify Tool malfunctions
Sometimes, switching the active layer (e.g. from NWIS to EPA) causes the HISIdentify tool to malfunction. An error message (see below) would display in the table of contents.
The user is advised to close and restart Internet Explorer and then navigate back to his.crwr.utexas.edu\his\. Because this starts a new session with the HIS server, the previous map extents, carts, etc. will be lost. Therefore, it is recommended that the user downloads the information (carts, csv, graphs, etc) he needs before switching active layers.
Map shifting without updating display
If you realize that you are getting information from the HIS server for a location that is different from where you clicked on the map, chances are the underlying map interface has shifted without updating the display. Please hit F5 to refresh the display. . This problem is being investigated.